Stock Portfolio Organizer
The ultimate porfolio management solution.
WiseTrader Toolbox
#1 Selling Amibroker Plugin featuring:
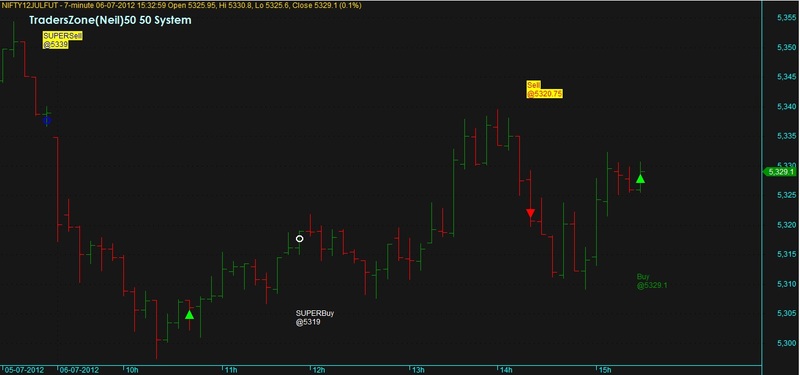
50 50 Trading System By TradersZone for Amibroker (AFL)
*Hi Friends
Below Link You Will Find Code Of My System
Prefer To Trade With Nifty Only
Rules:
Buy And Exit Rules:
Buy One Lot Nifty On Green Arrow Signal Buy 2nd Lot On Circle Super Buy Signal If Comes
Exit Nifty On Red Or Blue Circle Super Sell Signal Signal
Sell And Cover Rules:
Sell One Lot When Red Arrow Signal Sell 2nd Lot When Blue Circle SuperSellSignal If Comes
Exit On White Circle Or Green Arrow Signal
Green Arrow And Red Arrow Is Normal Buy Sell
White Circle And Blue Circle Super Buy Sell
White And Blue Circle Is Sign Of Strong Signal….
All The Best For This System
This System Is Not Holy Grail or 80% Or 90% Success Ratio
It Has Minimum 50% Ratio Maximum Depend On Trend Of Market…
If You Can’t Buy 2 Lot Nifty You Can Trade With Minifity So Risk Is Less
Do Paper Trade Before Trading With Real Money
I Am Not Superman So i Can Give You Perfect System
Money Profit Loss Tears Smile All Yours Decide Your Self What You Want…
Request To People Who Use Above System They Post Views Good Or Bad
Thank You And Happy Trading
*
Screenshots
Similar Indicators / Formulas
Indicator / Formula
_N(Title = StrFormat(EncodeColor( colorGold) + "{{NAME}} - {{INTERVAL}} {{DATE}} Open %g, Hi %g, Lo %g, Close %g (%.1f%%) {{VALUES}}", O, H, L, C, SelectedValue( ROC( C, 1 ) ) ));
    SetChartOptions(0,chartShowArrows|chartShowDates);


    SetChartBkColor(ColorRGB(23,23,23));


    priceStyle = IIf( (Interval(0) == -900), styleLine, styleBar);


    if (BeginValue(BarIndex()) != 0 AND EndValue(BarIndex()) != BarCount-1) {
    range = EndValue(BarIndex())-BeginValue(BarIndex());
    Title += StrFormat("\nRange Bars: %g", range);
    }

    CandleBorder = ParamColor("Candle Border Color", colorBlack );
    UpCandleColor = ParamColor("Up Candle Color", colorGreen );
    DownCandleColor = ParamColor("Down Candle Color", colorRed );


    Graph0BarColor = IIf( C > O,UpCandleColor ,DownCandleColor);

    Plot( C, "Close", CandleBorder, styleNoTitle | ParamStyle("Style") | priceStyle );


x = TEMA(Close,12);
y = TEMA(Close,20);
Z= TEMA(Close,50);
Buy=Cross(x,y );
Sell=Cross(y, x);

SUPERBUY=Cross(Y,Z);
SUPERSELL=Cross(Z,Y);
PlotShapes( SUPERBUY * shapeHollowCircle, colorWhite, 0);
PlotShapes( SUPERSELL * shapeHollowCircle, colorBlue, 0);
PlotShapes( Buy * shapeUpTriangle, colorBrightGreen, 0);
PlotShapes( Sell * shapeDownTriangle, colorRed, 0);


dist = 1.9*ATR(10);

for( i = 0; i < BarCount; i++ )
{
if( Buy[i] ) PlotText( "Buy\n@" + C[ i ], i, L[ i ]-dist[i], colorGreen );
if( Sell[i] ) PlotText( "Sell\n@" + C[ i ], i, H[ i ]+dist[i], colorRed, colorYellow );
if( SUPERBUY[i] ) PlotText( "SUPERSELL\n@" + C[ i ], i, L[ i ]-dist[i], colorWhite );
if( SUPERSELL[i] ) PlotText( "SUPERBUY\n@" + C[ i ], i, H[ i ]+dist[i], colorBlue, colorYellow );

}
_SECTION_BEGIN("AuthorName");
k = (GetPerformanceCounter()/100)%100;
printf("GetPerformance Counter %g",k);
GfxSelectFont("Century Gothic", 14,800);
GfxSetBkMode(3);
GfxSetTextColor(colorSkyblue);
GfxTextOut("TradersZone(Neil)50 50 System",-10+k,20);

RequestTimedRefresh(10);
_SECTION_END();
7 comments
Leave Comment
Please login here to leave a comment.
Back
IT IS SO SO SYSTEM,, I CHECKED 5 MINTE CHART SO MANY FALSE SIGNAL ALSO APPEAR,
HUMM ,, OK SYSTEM, BUT NOT GREAT
Did I Say Holy Grail Read Full Comments Also Don’t See Only Picture
I Tested On 7 Minute Data It Has 50%+ Success Ratio
Most Imp Is It’s Don’t Repaint
Signal Stay There Where They Comes…
Not Like Other System
After All All System Are Almost Same
How You Use It’s Imp
SORRY TRADERZONE I THINK IT HAS 10% SUCESS RATIO…
LOTS OF FALSE SIGNAL… LOTS OF NOISE… MUCH MUCH OVERTRADE.
ANYWAY I NEVER WISH TO TRY IT.
As You Wish
I Am Trading With 10 Minute Chart And Last Three Month It Gives 50% Hit Ratio
And Back-test Result Is Below
All trades 49
Winners 25 (51.02 %)
Losers 24 (48.98 %)
Profit Factor 2.00
earned 709 pts in 3months
No One Interested Then I Don’t Have Problem As Your Wish
Imp Is It’s Not Repainting ….. Like Other So Called Holy Grail I am Not Here To Do Marketing So Can’t Post Everyday Chart And Say Bla Bla
All i Have i Posted
Thanks for sharing
tz ji thanks for sharing. lots of noice in this afl.somany whipsaws comming.i think some modification required.
Raju Yes Whipsaws Is There That’s Why Told It’s 50 50 Hit :)
Anyway It’s 1st Version Only For Testing Will Do More Modification For More Accurate..
This System Is Prepare For Catch Big Trend So When Small Trade Will Hit Stoploss Only
Thank You For Comments Will Do Tweak And Come With 2nd Version