Stock Portfolio Organizer
The ultimate porfolio management solution.
Shares, Margin, CFD's, Futures and Forex
EOD and Realtime
Dividends and Trust Distributions
And Much More ....
WiseTrader Toolbox
#1 Selling Amibroker Plugin featuring:
Advanced Adaptive Indicators
Advanced Pattern Exploration
Neural Networks
And Much More ....
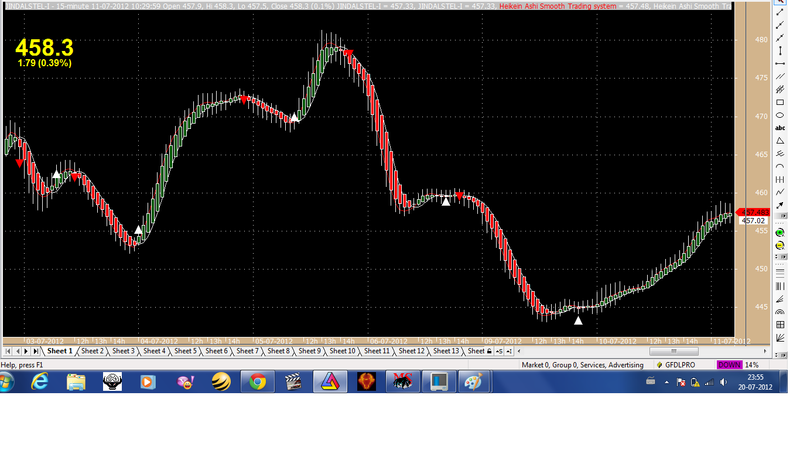
Heikin Ashi Smooth Trading System for Amibroker (AFL)
Rating:
4 / 5 (Votes 9)
Tags:
trading system, amibroker
This is a Heikin Ashi smooth trading system with buy & sell arrow with perfect bottoms and tops. Use it with other indicators like MACD and RSI, and you will get good results.
Screenshots
Similar Indicators / Formulas
All in One
Submitted
by Nahid over 15 years ago
Kase Peak Osc. V2 batu
Submitted
by batu1453 almost 12 years ago
Kase CD V2batu
Submitted
by batu1453 almost 12 years ago
Ichimoku
Submitted
by prashantrdx almost 12 years ago
Arvind' System
Submitted
by akdabc almost 16 years ago
Miftha remix for dse
Submitted
by coolpace almost 16 years ago
Indicator / Formula
Copy & Paste Friendly
SetChartBkGradientFill( ParamColor("BgTop", colorBlack),ParamColor("BgBottom", colorBlack),ParamColor("Titleblock",colorLightGrey ));
SetChartOptions(0,chartShowArrows|chartShowDates);
GraphXSpace=5;
p=Param("Period",6,2,30,1);
Om=MA(O,p);
hm=MA(H,p);
lm=MA(L,p);
Cm=MA(C,p);
HACLOSE=(Om+Hm+Lm+Cm)/4;
HaOpen = AMA( Ref( HaClose, -1 ), 0.5 );
HaHigh = Max( Hm, Max( HaClose, HaOpen ) );
HaLow = Min( Lm, Min( HaClose, HaOpen ) );
PlotOHLC( HaOpen, HaHigh, HaLow, HaClose, "" + Name(), colorWhite, styleCandle | styleNoLabel );
_SECTION_END();


_SECTION_BEGIN("Heiken Ashi Smoothed");
SetChartBkGradientFill( ParamColor("BgTop", colorBlack),ParamColor("BgBottom", colorBlack),ParamColor("Titleblock",colorLightGrey ));
SetChartOptions(0,chartShowArrows|chartShowDates);
GraphXSpace=5;
p=Param("Period",6,2,30,1);
Om=MA(O,p);
hm=MA(H,p);
lm=MA(L,p);
Cm=MA(C,p);
HACLOSE=(Om+Hm+Lm+Cm)/4;
HaOpen = AMA( Ref( HaClose, -1 ), 0.5 );
HaHigh = Max( Hm, Max( HaClose, HaOpen ) );
HaLow = Min( Lm, Min( HaClose, HaOpen ) );
PlotOHLC( HaOpen, HaHigh, HaLow, HaClose, "" + Name(), colorWhite, styleCandle | styleNoLabel );
_SECTION_END();
Line=ParamToggle("Show Line chart also","Hide|Show",0);
if(Line==1) {
Plot(C,"Close",colorWhite,styleLine);
}


a=LinearReg(HaClose, 5 ) ;
b=LinearReg( HaClose, 5 ) ;

Plot( IIf(HaHigh>HaOpen,a,b), _DEFAULT_NAME(), colorRed, ParamStyle("Style") );

Plot( LinearReg( HaOpen, 5 ), _DEFAULT_NAME(), colorWhite, ParamStyle("Style") );

_SECTION_BEGIN("kgs 12 26 ma buy sell");


a=MA(C,3) ;
b=MA(C,15) ;

Buy = Cross( a,b );
Sell = Cross( b,a );
//Short = Sell;
//Cover = Buy;

//AlertIf( Buy, "", "MA cross BUY", 1,1+2 );

//AlertIf( Sell, "", "MA cross SELL", 2 ,1+2);

PlotShapes( shapeUpTriangle*Buy, colorWhite, 0, L, -10 );
PlotShapes( shapeDownTriangle*Sell, colorRed, 0, H, -10 );
_SECTION_END();


_SECTION_BEGIN("Magnified Market Price");
//by Vidyasagar, vkunisetty@yahoo.com//
FS=Param("Font Size",30,30,100,1);
GfxSelectFont("Arial", FS, 900, italic = False, underline = False, True );
GfxSetBkMode( colorWhite );
GfxSetTextColor( ParamColor("Color",colorYellow) );
//Hor=Param("Horizontal Position",800,800,800,800);

Hor=Param("Horizontal Position",20,20,500,20);


Ver=Param("Vertical Position",50,50,250,50);
GfxTextOut(""+C,Hor , Ver );
YC=TimeFrameGetPrice("C",inDaily,-1);
DD=Prec(C-YC,2);
xx=Prec((DD/YC)*100,2);
GfxSelectFont("Arial", 12, 700, italic = False, underline = False, True );
GfxSetBkMode( colorWhite );
GfxSetTextColor(ParamColor("Color",colorYellow) );
GfxTextOut(""+DD+" ("+xx+"%)", Hor+5, Ver+45 );
_SECTION_END();


_SECTION_BEGIN("Price Line");


PriceLevel = ParamField("PriceField", field = 3 );

Daysback = Param("Bars Back",100,10,500,1);
FirstBar = BarCount - DaysBack;
YY = IIf(BarIndex() >= Firstbar,EndValue(PriceLevel),Null);


side = Param("side",1,0,1000,1);

dist = 0;

for( i = 0; i < BarCount; i++ )
{
if(i+side== BarCount) PlotText( "\n " + PriceLevel[ i ], i, YY[ i ]-dist[i], colorLightBlue );
}


_SECTION_END();

_SECTION_BEGIN("Price1");
SetChartOptions(0,chartShowArrows|chartShowDates);
_N(Title = StrFormat("{{NAME}} - {{INTERVAL}} {{DATE}} Open %g, Hi %g, Lo %g, Close %g (%.1f%%) {{VALUES}}", O, H, L, C, SelectedValue( ROC( C, 1 ) ) ));
//Plot( C, "Close", ParamColor("Color", colorBlack ), styleNoTitle | ParamStyle("Style") | GetPriceStyle() );
_SECTION_END();
8 comments
Leave Comment
Please login here to leave a comment.
Back
Thank you
Awesome work..Thanks !!!
Can I get this Indicator?
@Josue use the ‘Copy & Paste Friendly’ link above the formula.
Very useful. Thanks
Its very impressive.
Very good!!!
Some questions:
- Looking at the backtests the system buys at the opening price and sells at the opening price of the day that the cross.
- Would you have a way to program a target price for buying or selling? For example, if the next day price goes from xxxx buy.
If on the next day the price drops from xxx, sale.
I placed the purchases and sales for a day after the signal and the return lowered a down ….
Thanks again! Sorry for the bad translation.
As far as I can see this is just a simple MA crossover system.
The only part that works as a system is this;
Paste that into a new formula and you get the same results. All the rest is just fluff!
Am I wrong?