Stock Portfolio Organizer
The ultimate porfolio management solution.
Shares, Margin, CFD's, Futures and Forex
EOD and Realtime
Dividends and Trust Distributions
And Much More ....
WiseTrader Toolbox
#1 Selling Amibroker Plugin featuring:
Advanced Adaptive Indicators
Advanced Pattern Exploration
Neural Networks
And Much More ....
RMO COLOURED (Trade as per Ribbon) for Amibroker (AFL)
Rating:
3 / 5 (Votes 5)
Tags:
trading system, amibroker, exploration
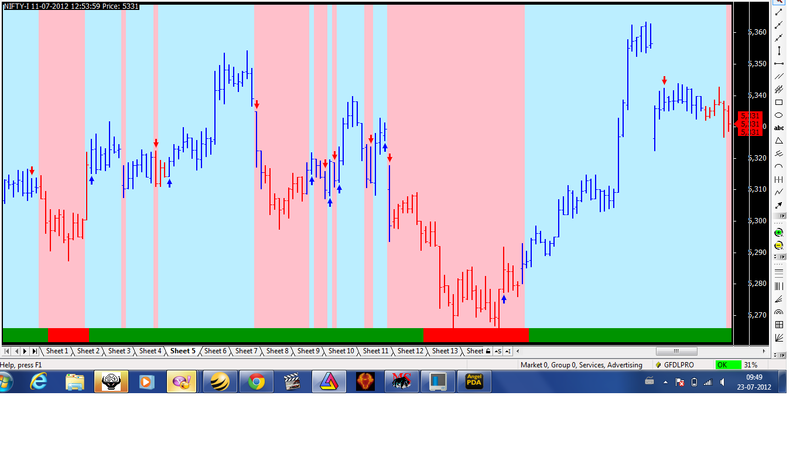
This is Rahul Mohinder Osicillator with Colour background. Trade with Ribbon colour…
Conditions to trade for RMO
For Sell Condition ::- If Ribbon is Red and u r getting Sell signal then only trade otherwise avoid others Signals. (Sell below the candle Low)
For Buy Condition ::- If Ribbon is Blue and u r getting Buy signal then only trade otherwise Avoid the others trades. (Buy above the candle High)
If any doubts , may ask by Comments.
Screenshots
Similar Indicators / Formulas
OPTIMIZED ICHIMOKU
Submitted
by ritesh.bafna88 over 11 years ago
Reaction Trend System
Submitted
by ajayjain90 almost 14 years ago
Behgozin Strength Finder
Submitted
by hotaro3 over 11 years ago
KPL with RSI
Submitted
by pdkg_gal almost 14 years ago
Intraday Trend Break System
Submitted
by nishantndk almost 14 years ago
ema crossovers
Submitted
by rushee.g1100 over 13 years ago
Indicator / Formula
Copy & Paste Friendly
_SECTION_BEGIN("RMO");
SwingTrd1 = 100 * (Close - ((MA(C,2)+
MA(MA(C,2),2)+
MA(MA(MA(C,2),2),2) +
MA(MA(MA(MA(C,2),2),2),2) +
MA(MA(MA(MA(MA(C,2),2),2),2),2) +
MA(MA(MA(MA(MA(MA(C,2),2),2),2),2),2) +
MA(MA(MA(MA(MA(MA(MA(C,2),2),2),2),2),2),2)+
MA(MA(MA(MA(MA(MA(MA(MA(C,2),2),2),2),2),2),2),2)+
MA(MA(MA(MA(MA(MA(MA(MA(MA(C,2),2),2),2),2),2),2), 2),2)+
MA(MA(MA(MA(MA(MA(MA(MA(MA(MA(C,2),2),2),2),2),2), 2),2),2),2))/10))/(HHV(C,10)-LLV(C,10));
SwingTrd2=EMA(SwingTrd1,30);
SwingTrd3=EMA(SwingTrd2,30);
RMO= EMA(SwingTrd1,81);
Buy=Cross(SwingTrd2,SwingTrd3);
Sell=Cross(SwingTrd3,SwingTrd2);
Bull_Trend=EMA(SwingTrd1,81)>0;
Bear_Trend=EMA(SwingTrd1,81)<0;
Ribbon_kol=IIf(Bull_Trend,colorGreen, IIf(Bear_Trend,colorRed, colorBlack));
Plot(4, "ribbon", Ribbon_kol, styleOwnScale|styleArea|styleNoLabel, -0.5,100);
Impulse_UP= EMA(SwingTrd1,30) > 0;
Impulse_Down= EMA(SwingTrd1,81) < 0;
bar_kol=IIf(impulse_UP, colorBlue, IIf(impulse_Down, colorRed,IIf(Bull_Trend, colorRed, colorBlue)));
Plot(Close,"Close",bar_kol,styleBar | styleThick );
shape = Buy * shapeUpArrow + Sell * shapeDownArrow;
PlotShapes( shape, IIf( Buy, colorBlue, colorRed ),0, IIf( Buy, Low, High ) );
_SECTION_END();


_SECTION_BEGIN("RMO");
SetChartBkColor(ParamColor("Outer panel color ",colorYellow));

SwingTrd1 = 100 * (Close - ((MA(C,2)+
MA(MA(C,2),2)+
MA(MA(MA(C,2),2),2) +
MA(MA(MA(MA(C,2),2),2),2) +
MA(MA(MA(MA(MA(C,2),2),2),2),2) +
MA(MA(MA(MA(MA(MA(C,2),2),2),2),2),2) +
MA(MA(MA(MA(MA(MA(MA(C,2),2),2),2),2),2),2)+
MA(MA(MA(MA(MA(MA(MA(MA(C,2),2),2),2),2),2),2),2)+
MA(MA(MA(MA(MA(MA(MA(MA(MA(C,2),2),2),2),2),2),2), 2),2)+
MA(MA(MA(MA(MA(MA(MA(MA(MA(MA(C,2),2),2),2),2),2), 2),2),2),2))
/10))/(HHV(C,10)-LLV(C,10));
SwingTrd2=
EMA(SwingTrd1,30);
SwingTrd3=
EMA(SwingTrd2,30);
RMO= EMA(SwingTrd1,81);
Buy=Cross(SwingTrd2,SwingTrd3);
Sell=Cross(SwingTrd3,SwingTrd2);
Bull_Trend=EMA(SwingTrd1,81)>0;
Bear_Trend=EMA(SwingTrd1,81)<0;
Ribbon_kol=IIf(Bull_Trend,colorBlue, IIf(Bear_Trend,colorRed, colorBlack));
//Plot(4, "ribbon", Ribbon_kol, styleOwnScale|styleArea|styleNoLabel, -0.5,100);
Impulse_UP= (EMA(SwingTrd1,30) > 0 AND EMA(SwingTrd1,30)>EMA(SwingTrd2,30)) ;
Impulse_Down= (EMA(SwingTrd1,30)< 0 AND EMA(SwingTrd1,30)<EMA(SwingTrd2,30));
bar_kol=IIf(impulse_UP, colorBlue, IIf(impulse_Down, colorRed, colorBlack));
Plot(Close,"Close",bar_kol,styleBar | styleThick );
shape = Buy * shapeUpArrow + Sell * shapeDownArrow;
//PlotShapes( shape, IIf( Buy, colorBlue, colorRed ),0, IIf( Buy, Low, High ) );
_SECTION_END();
Title=Name()+ " " + Date() + " Price: " + C;


Ribbon_kol=IIf(RSI(15)>50, colorCustom15, IIf(RSI(15)<50,colorPink,colorWhite));
Plot(100, "ribbon", Ribbon_kol, styleOwnScale|styleArea|styleNoLabel, -0.5,100);
q=IIf(RSI(15)>50,5,IIf(RSI(15)<50,-5,0));
Buy=Cross(q,2);
Sell=Cross(-2,q);

//Here is RMO code & Exploration i'm using successfully for last few
//months on 5Min. bars for single stock futures of indian NSE.

_SECTION_BEGIN( "RMO");
SwingTrd1 = 100 * (Close - ((MA(C,2)+
MA(MA(C,2),2) +
MA(MA(MA(C,2) ,2),2) +
MA(MA(MA(MA( C,2),2),2) ,2) +
MA(MA(MA(MA( MA(C,2),2) ,2),2),2) +
MA(MA(MA(MA( MA(MA(C,2) ,2),2),2) ,2),2) +
MA(MA(MA(MA( MA(MA(MA( C,2),2),2) ,2),2),2) ,2)+
MA(MA(MA(MA( MA(MA(MA( MA(C,2),2) ,2),2),2) ,2),2),2) +
MA(MA(MA(MA( MA(MA(MA( MA(MA(C,2) ,2),2),2) ,2),2),2) , 2),2)+
MA(MA(MA(MA( MA(MA(MA( MA(MA(MA( C,2),2),2) ,2),2),2) , 2),2),2),2))
/10))/(HHV(C, 10)-LLV(C, 10));
SwingTrd2=
EMA(SwingTrd1, 30);
SwingTrd3=
EMA(SwingTrd2, 30);
RMO= EMA(SwingTrd1, 81);
Buy=Cross(SwingTrd2 ,SwingTrd3) ;
Sell=Cross(SwingTrd3,SwingTrd2) ;
Bull_Trend=EMA( SwingTrd1, 81)>0;
Bear_Trend=EMA( SwingTrd1, 81)<0;
Ribbon_kol=IIf( Bull_Trend, colorGreen, IIf(Bear_Trend, colorRed,
colorBlack)) ;
Plot(4, "ribbon", Ribbon_kol, styleOwnScale| styleArea| styleNoLabel,
-0.5,100);
Impulse_UP= EMA(SwingTrd1, 30) > 0;
Impulse_Down= EMA(SwingTrd1, 81) < 0;
bar_kol=IIf( impulse_UP, colorBlue, IIf(impulse_Down,
colorRed,IIf( Bull_Trend, colorRed, colorBlue))) ;
Plot(Close," Close",bar_kol,styleBar | styleThick );
shape = Buy * shapeUpArrow + Sell * shapeDownArrow;
PlotShapes( shape, IIf( Buy, colorBlue, colorRed ),0, IIf( Buy, Low,
High ) );
_SECTION_END( );

//RMO EXPLORATIONS - INTRADAY
_SECTION_BEGIN( "RMO");
range = Param("Periods", 14, 2, 200, 1 );
//Plot( ADX(range), _DEFAULT_NAME(), ParamColor( "ADX color", colorBlue ), ParamStyle("ADX style", styleThick ) );
//Plot( PDI(range), "+DI", ParamColor( "+DI color", colorGreen ), ParamStyle("+DI style") );
//Plot( MDI(range), "-DI", ParamColor( "-DI color", colorRed ), ParamStyle("-DI style") );


WR_VALUE = -100 * ( HHV( H, range) - C )/( HHV( H, range ) - LLV( L, range ) );

ADX_VALUE=ADX(range);
PDI_VALUE = PDI(range);
MDI_VALUE=MDI(range);
New_Bullish = IIf(RMO > 0 AND Ref(RMO, -1) <= 0,1,0);
New_Bearish = IIf(RMO < 0 AND Ref(RMO, -1) >= 0,1,0);
New_Buy_Arrow = IIf(Cross(SwingTrd2 ,SwingTrd3) ,1,0) AND RMO >0;
New_Sell_Arrow = IIf(Cross(SwingTrd3 ,SwingTrd2) ,1,0) AND RMO <0;
New_Blue_Bar = IIf(Cross(SwingTrd2 ,0),1,0) AND RMO >0;
New_Red_Bar = IIf(Cross(0, SwingTrd2) ,1,0) AND RMO <0;
Old_Bullish = IIf(RMO > 0 AND Ref(RMO, -1) > 0,1,0);
Old_Bearish = IIf(RMO < 0 AND Ref(RMO, -1) < 0,1,0);
New_Buy_Bar = IIf(Ref(New_Buy_Arrow, -1) AND C > Ref(H,-1), 1, 0);
New_Sell_Bar = IIf(Ref(New_Sell_Arrow, -1) AND C < Ref(L,-1), 1, 0);
P_Buy = (Ref(RMO,-1) > 0) AND (Ref(New_Blue_Bar,-1) > 0);
P_Sell= (Ref(RMO,-1) < 0) AND (Ref(New_Red_Bar,-1) > 0);
CBR = RMO;
CBS2= SwingTrd2;
CBS3= SwingTrd3;
PBR = Ref(RMO,-1);
PBS2= Ref(SwingTrd2, -1);
PBS3= Ref(SwingTrd3, -1);
New3CBuy = ((CBR > 0) AND (CBS2 >0) AND (CBS2 > CBS3) AND ((PBR <= 0)
AND (PBS2 <=0) AND (PBS2 <= PBS3)));
New3CSell= ((CBR < 0) AND (CBS2 <0) AND (CBS2 < CBS3) AND ((PBR >= 0)
AND (PBS2 >=0) AND (PBS2 >= PBS3)));
New_Arrow_New_Bar_Buy = ((CBR > 0) AND (CBS2 >0) AND (CBS2 > CBS3) AND
((PBS2 <=0) AND (PBS2 <= PBS3)));
New_Arrow_New_Bar_Sell= ((CBR < 0) AND (CBS2 <0) AND (CBS2 < CBS3) AND
((PBS2 >=0) AND (PBS2 >= PBS3)));
B1=New_Buy_Bar;
S1=New_Sell_Bar;
B2=New3CBuy;
S2=New3CSell;
B3=New_Buy_Arrow;
S3=New_Sell_Arrow;
B4=New_Buy_Arrow;
S4=New_Sell_Arrow;
B5=New_Blue_Bar;
S5=New_Red_Bar;
B6=New_Bullish;
S6=New_Bearish;


Buy= (B1 OR B2 OR B3 OR B4 OR B5 OR B6) ;
Sell= (S1 OR S2 OR S3 OR S4 OR S5 OR S6);
Filter=Buy OR Sell;
SetOption("NoDefaultColumns" , True );
AddTextColumn( Name(),"Security ",1.2, colorDefault, colorDefault, 90);
AddColumn( DateTime(), "Date", formatDateTime,colorDefault, colorDefault, 100);
AddColumn(IIf( B1,66,IIf( S1,83,32) ),"New Trade Bar", formatChar, colorWhite, bkcolor =IIf(B1, colorGreen,IIf( S1,colorRed, colorDefault) ));
AddColumn(IIf( B2,66,IIf( S2,83,32) ),"New3C" , formatChar, colorWhite,bkcolor =IIf(B2, colorGreen,IIf( S2,colorRed, colorDefault) ));
AddColumn(IIf( B3,66,IIf( S3,83,32) ),"New Arrow+Bar", formatChar,colorWhite, bkcolor =IIf(B3, colorGreen,IIf( S3,colorRed, colorDefault) ));
AddColumn(IIf( B4,66,IIf( S4,83,32) ),"New Arrow", formatChar,colorWhite, bkcolor =IIf(B4, colorGreen,IIf( S4,colorRed, colorDefault) ));
AddColumn(IIf( B5,66,IIf( S5,83,32) ),"New Bar", formatChar, colorWhite,bkcolor =IIf(B5, colorGreen,IIf( S5,colorRed, colorDefault) ));
AddColumn(IIf( B6,66,IIf( S6,83,32) ),"New RMO", formatChar, colorWhite,bkcolor =IIf(B6, colorGreen,IIf( S6,colorRed, colorDefault) ));
AddColumn(ADX_VALUE,"ADX");
AddColumn(WR_VALUE,"Williams");
//bkcolor =IIf(B6, colorGreen,IIf( S6,colorRed, colorDefault) ));
//AlertIf( Buy, "SOUND C:\\Windows\ \Media\\chimes. wav", "Audio alert", 1, 1+8 );
//AlertIf( Sell, "SOUND C:\\Windows\ \Media\\ding. wav", "Audio alert", 2,1+8 );
_SECTION_END( );
11 comments
Leave Comment
Please login here to leave a comment.
Back
hi, thanks for posting such a wonderful system, it would be very nice of you if u could suggest what time frame we should use it on.
Work in 15 min timeframe.
Hi Anandnst, how about daily time frame? I tried running the system with daily time frame and found that most of the signals are quite late. Do you have any suggestion how to fix this problem? Thanks
Thanks for the AFL.
Kindly Let me know , where to place the SL
Daily Time frame,ur stoploss would be long, so i recommended 15 Min time frame. U need to trade according to Ribbon colour..if Ribbon is Red..u r getting red sell signal then go Short.Exit is on Next ribbon or Atr system given in my other Posted AFLS.
Gr8 System in this website – — BOLLINGER TRADING SYSTEM (MUST WATCH)
One more good trading system for Stoploss – SUPER TREND INDICATOR (MUST WATCH).
Mr. Swami , ur stoploss Query will be solved in these 2 trading system posted by me.
Hi Anandnst, thanks for the system
You have said that if the ribbon is green,and we get and arrow for the buy signal ,then we have to take the buy signal.(of course similar rules for sell signal).
My doubt is if i get a buy signal and the ribbon is green, i initiate the call. Now when i get a sell signal and the RIBBON IS STILL GREEN should i close the buy signal initiated
already or should i wait till the ribbon becomes red and i get a sell signal in THE RED RIBBON AREA.
Thanks
very good AFL
THX
Brgds
RAvi
hI
tHERE IS A NEW RMO system in 2013- latest metastock.
link is
http://www.youtube.com/watch?v=2eoc4BTZQOM&feature=player_embedded#!
It uses 3 separate indicators and take trades only and only if all three match. a histogram,a swing trade indicator consists of two lines,and a bar chart with up or down arrows.
The system is reportedly has far more success-
hope somebody codes it in Amibroker.
regards
ford
Hello Ford7k,
i would help you for that…
the system you are saying is provided by Viratech metastock providers (Above system is called RMO MODULE)
Google or search Viratechindia.. u will get all details.
Thanx you
Thats called RMO with zone detector , There are dormant zone which indicates the market is sideways and we should avoid any trade on that zone and if the zone is active we should trade according to the signal.
I know this threat is very old. I was just wondering if anyone ever coded the all of the RMO indicators for AmiBroker? I am willing to pay for the code.