Stock Portfolio Organizer
The ultimate porfolio management solution.
WiseTrader Toolbox
#1 Selling Amibroker Plugin featuring:
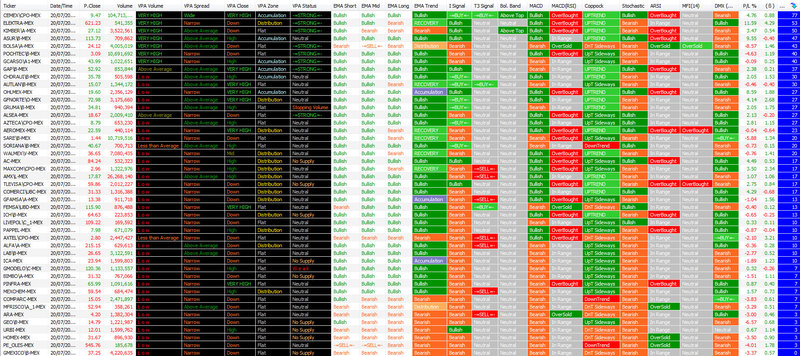
General Market Exploration by XeL for Amibroker (AFL)
Hi, I recently tweaked some code finding on the web and decided to make a “General Exploration” AFL in favor to acquire better skills on AmiBroker programming.
The Explorer by itself has Parameters included for each “indicator”, I added a “Profit and Loss” calculator for each symbol, regarding the Time Frame given on the parameters (Day to Date, Week to Date, Month to Date or Year to Date). A Ranking system has modified in order to acquire from the “best known readings” from each indicator based on a percentage score (0 to 100%).
Some indicators are incomplete, much of them are pasties of already ones finding on web.
I consider myself a Newbie on this field (AFL programming), so this is like a learning proyect to me, so please any correction, commentary or contribution regarding to this are Very Welcome.
Cheers Community.
XeL
Screenshots
Similar Indicators / Formulas
Indicator / Formula
/////////////////////////////////////////////////////////
//																//
//			General Market Exploration by XeL				//
//																//
//						Ver: 1.00.beta						//
//																//
//	Free to Distribute under LGPL 2012	.					//
//	Portions of Code are property of their original		//
//	authors, Cleaning, some new code and Preparation	//
//	are derived by @XeL_Arjona.								//
//	Some Original Code credits:								//
//																//
//	*	Volume Price Analysis by Karthikmarar				//
//			http://vpanalysis.blogspot.mx/					//
//																//
//	*	Jurik Research DMX (Free)							//
//			http://jurikres.com/catalog/ms_dmx.htm		//
//																//
//	*	Extract of some exploration Methodology			//
//		by Manish.												//
//																//
//																//
/////////////////////////////////////////////////////////


/////////////////
//  AFL START  //
/////////////////

//_SECTION_BEGIN("VPA, Momentum & Signal Explorer by XeL");


//////////////////////
// Main Variables   //
//////////////////////
// Count Index value for TrendScore
	i	=	0;
// Display Colors
// Main Color
	Color_buy		=	colorLime				;
	Color_bull		=	colorGreen				;
	Color_bull1	=	colorDarkYellow		;
	Color_bear1	=	colorLightOrange		;
	Color_bear		=	colorOrange			;
	Color_sell		=	colorRed				;
	Color_prev		=	colorGold				;
	Color_acc		=	colorPaleTurquoise	;
	Color_null		=	colorLightGrey		;
//	Background Colors
	BColor_vpa		=	colorBlack				;
	BColor_mas		=	colorDefault			;
	BColor_mam		=	colorDefault			;
	BColor_mal		=	colorDefault			;
//	Alternate Colors
	Color_acc1		=	colorBlueGrey			;

// 52 High Low
High52		=	HHV(High,250);
Low52		=	LLV(Low,250);
// T3 Function
function T3(price,periods)
	{
		s = 0.84;
		e1=EMA(price,periods);
		e2=EMA(e1,Periods);
		e3=EMA(e2,Periods);
		e4=EMA(e3,Periods);
		e5=EMA(e4,Periods);
		e6=EMA(e5,Periods);
		c1=-s*s*s;
		c2=3*s*s+3*s*s*s;
		c3=-6*s*s-3*s-3*s*s*s;
		c4=1+3*s+s*s*s+3*s*s;
		Ti3=c1*e6+c2*e5+c3*e4+c4*e3;
		return ti3;
	}


////////////////////////////////////////////////
// Time to Date % Change and Beta Correlation //
////////////////////////////////////////////////
_SECTION_BEGIN("P/L % Change over Time with Beta Correlation");
// PARAMETERS
	TtD_Param		=	ParamList("Period","Day to Date|Week to Date|Month to Date|Year to Date",0);
	IDX_Param		=	ParamStr("Reference Market Index Symbol","$IME-MEX");
// VARIABLES
	FDayMonth		=	BarsSince(Month() != Ref(Month(),-1));
	FDayYear		=	BarsSince(Year() != Ref(Year(),-1));
	TtD_Period		=	IIf(TtD_Param	==	"Day to Date",1,
						IIf(TtD_Param	==	"Week to Date",DayOfWeek(),
						IIf(TtD_Param	==	"Month to Date",FDayMonth,
						IIf(TtD_Param	==	"Year to Date",FDayYear,0))));
	IDX_Close		=	Foreign(IDX_Param,"Close");
// FORMULA
//		P/L % Change
	TtD_Change		= 100 * (Close - Ref(Close, -TtD_Period) ) / Ref(Close, -TtD_Period);
//		Beta Correlation in Time from Index
	Beta			=	(( TtD_Period * Sum(ROC( C,1) * ROC(IDX_Close,1),TtD_Period )) -
						(Sum(ROC(C,1),TtD_Period) *
						Sum(ROC( IDX_Close,1),TtD_Period))) /
						((TtD_Period * Sum((ROC(IDX_Close,1)^2 ),TtD_Period)) -
						(Sum(ROC(IDX_Close,1 ),TtD_Period)^2 ));
_SECTION_END();


///////////////////////////
// Volume Price Analysis //
///////////////////////////
_SECTION_BEGIN("Volume Price Analysis");
// FORMULA
	SetChartOptions(0,chartShowArrows|chartShowDates);
	DTL=Param("Linear regression period",60,10,100,10);
	wbf=Param("WRB factor",1.5,1.3,2.5,.1);
	nbf=Param("NRB factor",0.7,0.3,0.9,0.1);
	TL=LinRegSlope(MA(C, DTL),2);
	Vlp=Param("Volume lookback period",30,20,300,10);
	Vrg=MA(V,Vlp);
	St = StDev(Vrg,Vlp);
	Vp3 = Vrg + 3*st;
	Vp2 = Vrg + 2*st;;
	Vp1 = Vrg + 1*st;;
	Vn1 = Vrg -1*st;
	Vn2 = Vrg -2*st;
	rg=(H-L);
	arg=Wilders(rg,30);
	wrb=rg>(wbf*arg);
	nrb=rg<(nbf*arg);
	Vl=V<Ref(V,-1) AND V<Ref(V,-2);
	upbar=C>Ref(C,-1);
	dnbar=C<Ref(C,-1);
	Vh=V>Ref(V,-1) AND Ref(V,-1)>Ref(V,-2);
	Cloc=C-L;
	x=rg/Cloc;
	x1=IIf(Cloc=0,arg,x);
	Vb=V>Vrg OR V>Ref(V,-1);
	ucls=x1<2;
	dcls=x1>2;
	mcls=x1<2.2 AND x1>1.8 ;
	Vlcls=x1>4;
	Vhcls=x1<1.35;
	j=MA(C,5);
	TLL=LinRegSlope(j,40) ;
	Tlm=LinRegSlope(j,15) ;
	tls=LinRegSlope(j,5);
	mp=(H+L)/2;
// VOLUME VARIABLES
//		TrendScore Count
	IIf( V>Vp2, i+3,i);
	IIf( V>Vp1, i+2,i);
	IIf( V>VRG, i+1,i);
//		Indicators
	VPAv_Status	=	WriteIf( V>Vp2,	"VERY HIGH",
						WriteIf( V>Vp1,	"High",
						WriteIf( V>Vrg,	"Above Average",
						WriteIf( V<Vrg AND V>Vn1, "Less than Average",
						WriteIf( V<Vn1, "L o w", "" )))));
	VPAv_Color	=		IIf( V>Vp2, Color_buy,
						IIf( V>Vp1, Color_bull,
						IIf( V>Vrg, Color_bull1,
						IIf( V<Vrg AND V>Vn1, Color_bear,
						IIf( V<Vn1, Color_sell, Color_null )))));

// SPREAD VARIABLES
//		Indicators
	IIf( rg>(arg*2), i+2,i);
	IIf( rg>arg, i+1,i);
	VPAs_Status	=	WriteIf( rg>(arg*2), "Wide",
						WriteIf( rg>arg, "Above Average","Narrow"));
	VPAs_Color		=	IIf( rg>(arg*2), Color_buy,
						IIf( rg>arg, Color_bull,Color_bear));

// CLOSE VARIABLES
//		TrendScroe Count
	IIf( Vhcls, i+2,i);
	IIf( ucls, i+1,1);
//		Indicators
	VPAc_Status	=	WriteIf( Vhcls, "VERY HIGH",
						WriteIf( ucls, "High",
						WriteIf( mcls, "Mid",
						WriteIf( dcls, "Down","VERY LOW"))));
	VPAc_Color		=	IIf( Vhcls, Color_buy,
						IIf( ucls, Color_bull,
						IIf( mcls, Color_bull1,
						IIf( dcls, Color_bear,Color_sell))));

// VOLUME ZONE
// FORMULA
	C1 = Ref(C, -1);
	uc = C > C1; dc = C <= C1;
	ud = C > O; dd = C <= O;
	green = 1; blue = 2; yellow = 3; red = 4; white = 5;
	VType = IIf(ud,
	         IIf(uc, green, yellow),
	       IIf(dd,
	         IIf(dc, red, blue), white));
	/* green volume: up-day and up-close*/
	gv = IIf(VType == green, V, 0);
	/* yellow volume: up-day but down-close */
	yv = IIf(VType == yellow, V, 0);
	/* red volume: down-day and down-close */
	rv = IIf(VType == red, V, 0);
	/* blue volume: down-day but up-close */
	bv = IIf(VType == blue, V, 0);
	uv = gv + bv; uv1 = Ref(uv, -1); /* up volume */
	dv = rv + yv; dv1 = Ref(dv, -1); /* down volume */
	VolPer = Param("Adjust Vol. MA per.", 34, 1, 255, 1);//12
	ConvPer = Param("Adjust Conv. MA per.", 9, 1, 255, 1);//6
	MAuv = TEMA(uv, VolPer ); mauv1 = Ref(mauv, -1);
	MAdv = TEMA(dv, VolPer ); madv1 = Ref(madv, -1);
	MAtv = TEMA(V, VolPer );//total volume
	Converge = (TEMA(MAuv - MAdv, ConvPer));
	Converge1 = Ref(Converge, -1);
	ConvergeUp = Converge > Converge1;
	ConvergeOver = Converge > 0;
	rising = ConvergeUp AND ConvergeOver;
	falling = !ConvergeUp AND ConvergeOver;
// VOLUME ZONE
// VARIABLES
//		TrendScore Count
	IIf( rising, i+1,i);
//		Indicators
	VPAz_Status	=	WriteIf(rising,"Accumulation",
						WriteIf(falling,"Distribution","Flat"));
	VPAz_Color		=	IIf(rising,Color_acc,
						IIf(falling,Color_prev,Color_null));

// VOLUME STATUS
// PARAMETERS
	Pp1=Param("Number Of Days",30,1,200,1);
	Pp2=Param("Volume Of Days",15,1,200,1);
// FORMULA
	numDays = Pp1;
	dwWideSpread = 1.8;
	dwNarrowSpread = 0.8;
	dwSpreadMiddle = 0.5;
	dwHighClose = 0.7;
	dwLowClose = 0.3;
	volNumDays = Pp2;
	dwUltraHighVol = 2;
	dwVeryHighVol = 1.75; // was 1.8
	dwHighVol = 1.75; // was 1.8
	dwmoderateVol = 1.10; // was 1.8
	dwLowVol = 0.75; // was 0.8
	/* Classify each bar... */
	upBar = C > Ref(C,-1);
	downBar = C < Ref(C,-1);
	spread = H-L;
	avgRange = Sum(spread, numDays) / numDays;
	wideRange = spread >= (dwWideSpread * avgRange);
	narrowRange = spread <= (dwNarrowSpread * avgRange);
	testHighClose = L + (spread * dwHighClose);
	testLowClose = L + (spread * dwLowClose);
	testCloseMiddle = L + (spread * dwSpreadMiddle);
	upClose = C > testHighClose;
	downClose = C < testLowClose;
	middleClose = C >= testLowClose AND C <= testHighClose;
	avgVolume = EMA(V, volNumDays);
	highVolume = V > (avgVolume * dwHighVol);
	moderateVol= V > (avgVolume * dwmoderateVol);
	veryHighVolume = V > (avgVolume * dwVeryHighVol);
	ultraHighVolume = V > (avgVolume * dwUltraHighVol);
	LowVolume = V < (avgVolume * dwLowVol);
	/* direction AND Title */
	/* Basic patterns... */
	upThrustBar = downClose AND H > Ref(H,-1) AND (C == L) AND downClose AND (NOT narrowRange);
	noDemandBar = narrowRange AND LowVolume AND upBar AND (NOT upClose);
	//noDemandBar = narrowRange AND LowVolume AND upBar AND (V < Ref(V,-1)) AND (V < Ref(V,-2));
	noSupplyBar = narrowRange AND LowVolume AND downBar AND (V < Ref(V,-1)) AND (V < Ref(V,-2));
	absorption = Ref(downbar, -1) AND Ref(highVolume, -1) AND upBar;
	support = Ref(downBar,-1) AND (NOT Ref(downClose,-1)) AND Ref(highVolume,-1) AND upBar;
	stoppingVolume = Ref(downBar,-1) AND Ref(highVolume,-1) AND C > testCloseMiddle AND (NOT downBar);
	bullishsign=moderateVol+UpThrustBar;//OR moderateVol+upBar;
	//rallyEnd = (Ref(highVolume,-1) AND Ref(upBar,-1) AND wideRange AND downBar) OR
	// (narrowRange AND highVolume AND H > Ref(HHV(H, 250), -1));
	/* Strength AND Weakness */
	weakness = upThrustBar OR noDemandBar OR
	(narrowRange AND (H > Ref(H,-1)) AND highVolume) OR
	(Ref(highVolume,-1) AND Ref(upBar,-1) AND downBar AND (H < Ref(H,-1)));
// VARIABLES
//		TrendScore Count
	IIf( bullishsign, i+3,i);
	IIf( upThrustBar, i+2,i);
	IIf( absorption, i+1,i);
//		Indicators
	VPAst_Status	=	WriteIf(Weakness,"W e a k",
						WriteIf(StoppingVolume,"Stopping Volume",
						WriteIf(noSupplyBar,"No Supply",
						WriteIf(support,"Support",
						WriteIf(noDemandBar,"No Demand",
						WriteIf(absorption,"Absorption",
						WriteIf(upThrustBar,"Up Thrust",
						WriteIf(bullishsign,"-=STRONG=-","Neutral"))))))));
	VPAst_Color	=	IIf(Weakness,Color_sell,
						IIf(StoppingVolume,Color_bear,
						IIf(noSupplyBar,Color_bear1,
						IIf(support,Color_bear,
						IIf(noDemandBar,Color_prev,
						IIf(absorption,Color_bull1,
						IIf(upThrustBar,Color_bull,
						IIf(bullishsign,Color_buy,Color_null))))))));
_SECTION_END();


//////////////////////////
// EMA Terms and Trend  //
//////////////////////////
_SECTION_BEGIN("EMA Short, Mid and Long Terms and Trend");
// PARAMETERS
	EMAs1Pds	=	Param("1st. Short Term Period",9,5,14,1);
	EMAs2Pds	=	Param("2nd. Short Term Period",20,15,45,1);
	EMAmPds	=	Param("Mid Term Period",50,46,90,1);
	EMAlPds	=	Param("Long Term Perdiod",200,100,300,1);
// FORMULA
//	EMA Short term signals
	EMAsBuy	=	Cross(EMA(C,EMAs1Pds), EMA(C,EMAs2Pds));
	EMAsSell	=	Cross(EMA(C,EMAs2Pds),EMA(C,EMAs1Pds));
	EMAsBuy	=	ExRem(EMAsBuy, EMAsSell);
	EMAsSell	=	ExRem(EMAsSell, EMAsBuy);
	EMAsBull	=	EMA(C,EMAs1Pds) > EMA(C,EMAs2Pds);
	EMAsBear	=	EMA(C,EMAs1Pds) < EMA(C,EMAs2Pds);
//	EMA Mid term signals
	EMAmBuy	=	Cross(EMA(C,(EMAs1Pds+EMAs2Pds)/2), EMA(C,EMAmPds));
	EMAmSell	=	Cross(EMA(C,EMAmPds), EMA(C,(EMAs1Pds+EMAs2Pds)/2));
	EMAmBuy	=	ExRem(EMAmBuy, EMAmSell);
	EMAmSell	=	ExRem(EMAmSell, EMAmBuy);
	EMAmBull	=	C > EMA(C,EMAmPds);
	EMAmBear	=	C < EMA(C,EMAmPds);
//	EMA Long term signals
	EMAlBuy	=	Cross(EMA(C,EMAmPds), EMA(C,EMAlPds));
	EMAlSell	=	Cross(EMA(C,EMAlPds), EMA(C,EMAmPds));
	EMAlBuy	=	ExRem(EMAlBuy, EMAlSell);
	EMAlSell	=	ExRem(EMAlSell, EMAlBuy);
	EMAlBull	=	C > EMA(C,EMAlPds);
	EMAlBear	=	C < EMA(C,EMAlPds);
// EMA Positional Price Trend (Long-Term)
	EMA_rc		=	C > EMA (C,EMAmPds) AND C < EMA(C,EMAlPds) AND EMA(C,EMAmPds) < EMA(C,EMAlPds);
	EMA_ac		=	C > EMA (C,EMAmPds) AND C > EMA(C,EMAlPds) AND EMA(C,EMAmPds) < EMA(C,EMAlPds);
	EMA_bl		=	C > EMA (C,EMAmPds) AND C > EMA(C,EMAlPds) AND EMA(C,EMAmPds) > EMA(C,EMAlPds);
	EMA_pr		=	C < EMA (C,EMAmPds) AND C > EMA(C,EMAlPds) AND EMA(C,EMAmPds) > EMA(C,EMAlPds);
	EMA_ds		=	C < EMA (C,EMAmPds) AND C < EMA(C,EMAlPds) AND EMA(C,EMAmPds) > EMA(C,EMAlPds);
	EMA_br		=	C < EMA (C,EMAmPds) AND C < EMA(C,EMAlPds) AND EMA(C,EMAmPds) < EMA(C,EMAlPds);
// VARIABLES
//		TrendScore Count
	IIf(EMAsBuy,i+1,i);
	IIf(EMAmBuy,i+1,i);
	IIf(EMAlBuy,i+1,i);
	IIf(EMA_rc,i+3,i);
	IIf(EMA_ac,i+2,i);
	IIf(EMA_bl,i+1,1);
	EMAs_Status	=	WriteIf(EMAsBuy, "-=BUY=-",
						WriteIf(EMAsSell, "-=SELL=-",
						WriteIf(EMAsBull, "Bullish",
						WriteIf(EMAsBear, "Bearish","Neutral"))));
	EMAs_Color		=	IIf(EMAsBuy, Color_buy,
						IIf(EMAsBull, Color_bull,
						IIf(EMAsBear, Color_bear,
						IIf(EMAsSell, Color_sell,Color_null))));
	EMAm_Status	=	WriteIf(EMAmBuy, "-=BUY=-",
						WriteIf(EMAmSell, "-=SELL=-",
						WriteIf(EMAmBull, "Bullish",
						WriteIf(EMAmBear, "Bearish","Neutral"))));
	EMAm_Color		=	IIf(EMAmBuy, Color_buy,
						IIf(EMAmBull, Color_bull,
						IIf(EMAmBear, Color_bear,
						IIf(EMAmSell, Color_sell,Color_null))));
	EMAl_Status	=	WriteIf(EMAlBuy, "-=BUY=-",
						WriteIf(EMAlSell, "-=SELL=-",
						WriteIf(EMAlBull, "Bullish",
						WriteIf(EMAlBear, "Bearish","Neutral"))));
	EMAl_Color		=	IIf(EMAlBuy, Color_buy,
						IIf(EMAlBull, Color_bull,
						IIf(EMAlBear, Color_bear,
						IIf(EMAlSell, Color_sell,Color_null))));
	EMAp_Status	=	WriteIf(EMA_rc, "RECOVERY",
						WriteIf(EMA_ac, "Accumulation",
						WriteIf(EMA_bl, "Bullish",
						WriteIf(EMA_pr, "Preventive",
						WriteIf(EMA_ds, "Distribution",
						WriteIf(EMA_br, "Bearish","Neutral"))))));
	EMAp_Color		=	IIf(EMA_rc, Color_buy,
						IIf(EMA_ac, Color_acc1,
						IIf(EMA_bl, Color_bull,
						IIf(EMA_pr, Color_prev,
						IIf(EMA_ds, Color_bear1,
						IIf(EMA_br, Color_bear,Color_null))))));
_SECTION_END();


////////////////////////
// Initial Buy signal //
////////////////////////
_SECTION_BEGIN("IBuy Signal");
// FORMULA
	I_buy =  Cross(RSI(14), EMA(RSI(14),9));
	I_sell = Cross(EMA(RSI(14),9), RSI(14));
	I_buy = ExRem(I_buy, I_sell);
	I_sell = ExRem(I_sell, I_buy);
	I_bull = RSI(14) > EMA(RSI(14),9);
	I_bear = RSI(14) < EMA(RSI(14),9);
// VARIABLES
//		TrendScore Count
	IIf(I_buy,i+2,i);
	IIf(I_bull,i+1,i);
//		Indicators
	I_Status	=	WriteIf(I_buy,"-=BUY=-",
					WriteIf(I_bull,"Bullish",
					WriteIf(I_bear,"Bearish",
					WriteIf(I_sell,"-=SELL=-","Neutral"))));
	I_Color	=	IIf(I_buy,Color_buy,
					IIf(I_bull,Color_bull,
					IIf(I_bear,Color_bear,
					IIf(I_sell,Color_sell,Color_null))));
_SECTION_END();


/////////////////////
// Price Smoothing //
/////////////////////
_SECTION_BEGIN("T3 Price Smoothing Signal");
// FORMULA
	T3_buy		=	Cross (T3(C,3), T3(C,5));
	T3_sell	=	Cross (T3(C,5), T3(C,3));
	T3_buy		=	ExRem(T3_buy, T3_sell);
	T3_sell	=	ExRem(T3_sell, T3_buy);
// VARIABLES
//		TrendScore Count
	IIf(T3_buy,i+1,i);
//		Indicators
	T3_Status	=	WriteIf(T3_buy,"-=BUY=-",
					WriteIf(T3_sell,"-=SELL=-","Neutral"));
	T3_Color	=	IIf(T3_buy,Color_buy,
					IIf(T3_sell,Color_sell,Color_null));
_SECTION_END();


////////////////////
// Bollinger Band //
////////////////////
_SECTION_BEGIN("Bollinger Bands");
// FORMULA
	BB1			=	C>BBandTop(C,20,2) AND Ref(C,-1)<Ref(BBandTop(C,20,2),-1);
	BB2			=	C<BBandBot(C,20,2) AND Ref(C,-1)>Ref(BBandBot(C,20,2),-1);
// VARIABLES
//		TrendScore Count
	IIf(BB1,i+1,i);
//		Indicators
	BB_Status	=	WriteIf(BB1,"Above Top",
					WriteIf(BB2,"Below Bottom",
					WriteIf(IsNull(MA(C,20)),"N/A","Neutral")));
	BB_Color	=	IIf(BB1,Color_bull,
					IIf(BB2,Color_bear,Color_null));
_SECTION_END();


//////////
// MACD //
//////////
_SECTION_BEGIN("MACD Signal");
// FORMULA
	MACDBull		=	MACD(12,26)>Signal(12,26,9);
// VARIABLES
//		TrendScore Count
	IIf(MACDBull,i+1,i);
//		Indicators
	MACD_Status		=	WriteIf(MACDBull,"Bullish",
							WriteIf(IsNull(MACD(12,26)),"N/A","Bearish"));
	MACD_Color			=	IIf(MACDBull,Color_bull,
							IIf(IsNull(MACD(12,26)),Color_null,Color_bear));
_SECTION_END();


/////////////////
// RSI of MACD //
/////////////////
_SECTION_BEGIN("RSI of MACD Signal");
// PARAMETERS
	RSItPds=Param("Period",14,7,33,1);
	RSItOb_Parm=Param("OverBought Level",70,-200,200,5);
	RSItOs_Parm=Param("OverSold Level",30,-200,200,5);
// FORMULA
	Var=MACD();
	Up=IIf(Var>Ref(Var,-1),abs(Var-Ref(Var,-1)),0);
	Dn=IIf(Var<Ref(Var,-1),abs(Var-Ref(Var,-1)),0);
	Ut=Wilders(Up,RSItPds);
	Dt=Wilders(Dn,RSItPds);
	RSIt=100*(Ut/(Ut+Dt));
	//RSItBuy	=	RSIt < RSItOs_Parm AND RSIt > Ref(RSIt,-1);
	//RSItOs		=	RSIt < RSItOs_Parm AND RSIt < Ref(RSIt,-1);
	//RSItNu		=	RSIt < RSItOs_Parm AND RSIt > RSItOb_Parm AND RSIt > Ref(RSIt,-1);
	//RSItNd		=	RSIt < RSItOs_Parm AND RSIt > RSItOb_Parm AND RSIt < Ref(RSIt,-1);
	//RSItOb		=	RSIt <	RSItOb_Parm AND RSIt > Ref(RSIt,-1);
	//RSItSell		=	RSIt <	RSItOb_Parm AND RSIt < Ref(RSIt,-1);
	RSItOs			=	RSIt < RSItOs_Parm;
	RSItOb			=	RSIt > RSItOb_Parm;
	// VARIABLES
	//		TrendScore Count
	IIf(RSItOs, i+1,i);
	//		Indicators
	RSIt_Status	=	WriteIf(RSItOs,"OverSold",
						WriteIf(RSItOb,"OverBought","In Range"));
	RSIt_Color	=		IIf(RSItOs,Color_bull,
						IIf(RSItOb,Color_sell,Color_null));
_SECTION_END();


///////////
// Aroon //
///////////
//_SECTION_BEGIN("AROON Signal");
//// PARAMETERS
//	ArPeriod=Param("Period",14,7,33,1);
//// FORMULA
//	LLVBarsSince=LLVBars(L,ArPeriod)+1;
//	HHVBarsSince=HHVBars(H,ArPeriod)+1;
//	AroonDown=100*(ArPeriod-LLVBarsSince)/(ArPeriod-1);
//	AroonUp=100*(ArPeriod-HHVBarsSince)/(ArPeriod-1);
//	AroonOsc=AroonUp-AroonDown;
//	Aroon=AroonOsc>0;
//// VARIABLES
//	IIf(Aroon,i+1,i);
//	AROON_Status	=	WriteIf(Aroon,"Bullish",
//						WriteIf(IsNull (RSI(14)),"N/A","Bearish"));
//	AROON_Color	=	IIf(Aroon,Color_bull,
//						IIf(IsNull(RSI(14) ),Color_null,Color_bear));
//_SECTION_END();


/////////
// WAD //
/////////
//_SECTION_BEGIN("Williams Accumulation-Distribution Signal");
// PARAMETERS
//	WADPds=Param("Period",20,7,33,1);
	// FORMULA
//	TrueRangeHigh=Max( Ref(Close,-1), High );
//	TrueRangeLow=Min( Ref(Close,-1), Low );
//	WAD = Cum(IIf(C > Ref(C,-1),C-TrueRangeLow, IIf(C < Ref(C,-1),C-TrueRangeHigh,0)));
//	wadup = WAD > EMA (WAD,WADPds);
//	waddn = WAD < EMA (WAD,WADPds);
//	wadbl = Cross(WAD, EMA(WAD,WADPds));
//	wadbr = Cross(EMA(WAD,WADPds), WAD);
// VARIABLES
//	WAD_Status	=	WriteIf(wadup, "Bullish Zone",
//					WriteIf(waddn, "Bearish Zone",
//					WriteIf(wadbl, "Bullish Cross",
//					WriteIf(wadbr, "Bearish Cross","Neutral"))));
//	WAD_Color	=	IIf(wadup,Color_bull,
//					IIf(wadbl,Color_bear,
//					IIf(wadbr,Color_bull1,
//					IIf(waddn,Color_bear1,Color_null))));
//_SECTION_END();


/////////////
// Coppock //
/////////////
_SECTION_BEGIN("Coppock Indicator");
// FORMULA
	CKr1=ROC(C,14);
	CKr2=ROC(C,11);
	CK=EMA((CKr1+CKr2),10);
	CK_upt=IIf(ck>0 AND ROC(ck,1)>0,ck,0);
	CK_ups=IIf(ck>0 AND ROC(ck,1)<0,ck,0);
	CK_dws=IIf(ck<0 AND ROC(ck,1)>0,ck,0);
	CK_dwt=IIf(ck<0 AND ROC(ck,1)<0,ck,0);
// VARIABLES
//		TrendScore Count
	IIf(CK_upt,i+2,i);
	IIf(CK_ups,i+1,i);
//		Indicators
	Coppock_Status	=	WriteIf( CK_upt,"UPTREND",
							WriteIf( CK_ups,"UpT Sideways",
							WriteIf( CK_dws,"DnT Sideways",
							WriteIf( CK_dwt,"DownTrend","Flat"))));
	Coppock_Color		=	IIf( CK_upt,Color_buy,
							IIf( CK_ups,Color_bull,
							IIf( CK_dws,Color_bear,
							IIf( CK_dwt,Color_sell,Color_null))));
_SECTION_END();


////////////////
// Stochastic //
////////////////
_SECTION_BEGIN("Stochastic %D %K Signal");
// FORMULA
	StochKBull		=	StochK(14,3)>StochD(14,3,3);
// VARIABLES
//		TrendScore Count
	IIf(StochKBull,i+1,i);
//		Indicators
	STOCH_Status	=	WriteIf( StochKBull,"Bullish",
						WriteIf( IsNull(StochK(14,3)),"N/A","Bearish"));
	STOCH_Color	=	IIf(StochKBull,Color_bull,
						IIf( IsNull(StochK(14,3)),Color_null,Color_bear));
_SECTION_END();


//////////
// ARSI //
//////////
_SECTION_BEGIN("ARSI Signal");
// PARAMETERS
	ARSI_Pds		=	Param("Period",14,7,33,1);
	ARSIOb_Parm	=	Param("OverBought Level",70,-200,200,5);
	ARSIOs_Parm	=	Param("OverSold Level",30,-200,200,5);
// FORMULA
	Chg 			=	C - Ref( C, -1 );
	UpCount		=	Sum( Chg >= 0, ARSI_Pds );
	DnCount		=	ARSI_Pds - UpCount;
	UpMove			=	AMA( Max( Chg, 0 ), Nz(1/UpCount) );
	DnMove			=	AMA( Max( -Chg, 0 ), Nz(1/DnCount) );
	RS				=	UpMove/DnMove;
	ARSI			=	100-(100/(1+RS));
	ARSIOs			=	ARSI < ARSIOs_Parm;
	ARSIOb			=	ARSI > ARSIOb_Parm;
	//ARSIUt		=	ARSI > Ref(ARSI,-1);
	//ARSIDt		=	ARSI < Ref(ARSI,-1);
	//ARSIBuy		=	ARSI < ARSIOs AND ARSIUt;
	//ARSISell		=	ARSI >	ARSIOb AND ARSIDt;
	//ARSIBuy		=	ExRem(ARSIBuy, ARSISell);
	//ARSISell		=	ExRem(ARSISell,ARSIBuy);
// VARIABLES
//		TrendScroe Count
	IIf(ARSIOs,i+1,i);
//		Indicators
	ARSI_Status		=	WriteIf(ARSIOs,"OverSold",
							WriteIf(ARSIOb,"OverBought","In Range"));
							//WriteIf(ARSIBuy,"-=BUY=-",
							//WriteIf(ARSI>ARSIOs,"OverSold",
							//WriteIf(ARSIUt,"Improving",
							//WriteIf(ARSIDt,"Declining",
							//WriteIf(ARSI<ARSIOb,"OverBought",
							//WriteIf(ARSISell,"-=SELL=-",""))))));
	ARSI_Color		=		IIf(ARSIOs,Color_bull,
							IIf(ARSIOb,Color_sell,Color_null));
							//IIf(ARSIBuy,Color_buy,
							//IIf(ARSI>ARSIOs,Color_bull,
							//IIf(ARSIUt,Color_bull1,
							//IIf(ARSIDt,Color_bear1,
							//IIf(ARSI<ARSIOb,Color_bear,
							//IIf(ARSISell,Color_sell,Color_null))))));
_SECTION_END();


/////////
// RSI //
/////////
//_SECTION_BEGIN("RSI Signal");
// PARAMETERS
//	RSIPds=Param("Period",14,7,33,1);
//	RSIOb=Param("OverBought Level",70,-200,200,5);
//	RSIOs=Param("OverSold Level",30,-200,200,5);
// FORMULA
//	R1=RSI(RSIPds)>RSIOs AND Ref(RSI(RSIPds),-1)<RSIOs AND Ref(RSI(RSIPds),-2)<RSIOs;
//	R2=RSI(RSIPds)<RSIOb AND Ref(RSI(RSIPds),-1)>RSIOb AND Ref(RSI(RSIPds),-2)>RSIOb;
// VARIABLES
//	IIf(R1,i+1,i);
//	RSI_Status		=	WriteIf(R1,"Improving",
//						WriteIf(R2,"Declining",
//						WriteIf(IsNull(RSI(14)),"N/A","Neutral")));
//	RSI_Color		=	IIf(R1,Color_bull1,
//						IIf(R2,Color_bear1,Color_null));
//_SECTION_END();


/////////
// MFI //
/////////
_SECTION_BEGIN("MFI Signal");
// PARAMETERS
	MFIPds=Param("Period",14,7,33,1);
	MFIOb=Param("OverBought Level",80,-200,200,5);
	MFIOs=Param("OverSold Level",20,-200,200,5);
// FORMULA
	M1=MFI(MFIPds)>MFIOb;
	M2=MFI(MFIPds)<MFIOs;
//	VARIABLES
//		TrendScroe Count
	IIf(M2,i+1,i);
//		Indicators
	MFI_Status		=	WriteIf(M1,"OverBought",
						WriteIf(M2,"OverSold",
						WriteIf(IsNull(MFI(MFIPds)),"Null","Neutral")));
	MFI_Color		=	IIf(M1,Color_sell,
						IIf(M2,Color_buy,Color_null));
_SECTION_END();


/////////////////////////////////
// ADX Trend Strenght with ADX //
/////////////////////////////////
_SECTION_BEGIN("ADX Signal");
// JSB Lib Version
// INITIALIZATION
	SetBarsRequired(100000, 100000);
	JSB_InitLib();
// PARAMETERS
	ADX_Parm	=	Param( "ADX Period", 10, 5, 50,1);
// FORMULA
//	ADX Buy, Sell & Choppy Signal
	ADX_up		=	JSB_JDMX(C,ADX_Parm) > 0;
	ADX_dn		=	JSB_JDMX(C,ADX_Parm) < 0;
	ADX_ch		=	JSB_JDMX(C,ADX_Parm) < JSB_JDMXplus(C,ADX_Parm) AND JSB_JDMX(C,ADX_Parm) < JSB_JDMXminus(C,ADX_Parm);
	ADX_Buy	=	Cross(JSB_JDMXplus(C,ADX_Parm), JSB_JDMXminus(C,ADX_Parm));
	ADX_Sell	=	Cross(JSB_JDMXminus(C,ADX_Parm), JSB_JDMXplus(C,ADX_Parm));
	ADX_Buy	=	ExRem(ADX_Buy, ADX_Sell);
	ADX_Sell	=	ExRem(ADX_Sell, ADX_Buy);
	ADX_bull	=	JSB_JDMXplus(C,ADX_Parm) > JSB_JDMXminus(C,ADX_Parm);
	ADX_bear	=	JSB_JDMXminus(C,ADX_Parm)> JSB_JDMXplus(C,ADX_Parm);
// ADX Trend Confirmation Signal
	ADXwk		=	ADX(ADX_Parm) < 25;
	ADXst		=	ADX(ADX_Parm) > 25 AND ADX(ADX_Parm) < 50;
	ADXvs		=	ADX(ADX_Parm) > 50 AND ADX(ADX_Parm) < 75;
	ADXex		=	ADX(ADX_Parm) > 75 AND ADX(ADX_Parm) < 100;
	ADXchoppy	=	ADX(ADX_Parm) < PDI(ADX_Parm) AND ADX(ADX_Parm) < MDI(ADX_Parm);
// VARIABLES
//		TrendScore Count
	IIf(ADX_Buy,i+2,i);
	IIf(ADX_bull,i+1,i);
//	IIf(ADXst,i+1,i);
//		Indicators
	ADX_Status		=	WriteIf(ADX_Buy,"-=BUY=-",
						WriteIf(ADX_bull,"Bullish",
						WriteIf(ADX_bear,"Bearish",
						WriteIf(ADX_Sell,"-=SELL=-","Neutral"))));
	ADX_Color		=	IIf(ADX_Buy,Color_buy,
						IIf(ADX_bull,Color_bull,
						IIf(ADX_bear,Color_bear,
						IIf(ADX_Sell,Color_sell,Color_null))));
	//ADXc_Status	=	WriteIf(ADXwk,"Weak",
	//					WriteIf(ADXst,"Good",
	//					WriteIf(ADXvs,"Strong",
	//					WriteIf(ADXex,"EXCELENT",
	//					WriteIf(ADXchoppy,"Choppy","Neutral")))));
	//ADXc_Color		=	IIf(ADXwk,Color_sell,
	//					IIf(ADXst,Color_bull1,
	//					IIf(ADXvs,Color_bull,
	//					IIf(ADXex,Color_buy,
	//					IIf(ADXchoppy,Color_prev,Color_null)))));
_SECTION_END();


///////////////////////
// Trend Score Count //
///////////////////////
_SECTION_BEGIN("Trend Score Count");
	TrendScore		=	IIf(V>Vp2,3,0) +
						IIf(V>Vp1,2,0) +
						IIf(V>VRG,1,0) +
						IIf(rg>(arg*2),2,0) +
						IIf(rg>arg,1,0) +
						IIf(rising,1,0) +
						IIf(bullishsign,3,0) +
						IIf(upThrustBar,2,0) +
						IIf(absorption,1,0) +
						IIf(EMAsBuy,1,0) +
						IIf(EMAmBuy,1,0) +
						IIf(EMAlBuy,1,0) +
						IIf(EMA_rc,3,0) +
						IIf(EMA_ac,2,0) +
						IIf(EMA_bl,1,0) +
						IIf(I_buy,2,0) +
						IIf(I_bull,1,0) +
						IIf(T3_buy,1,0) +
						IIf(BB1,1,0) +
						IIf(MACDBull,1,0) +
						//IIf(Aroon,1,0) +
						IIf(CK_upt,2,0) +
						IIf(CK_ups,1,0) +
						IIf(StochKBull,1,0) +
						IIf(RSItOs,1,0) +
						IIf(ARSIOs,1,0) +
						//IIf(R1,1,0) +
						IIf(M2,1,0) +
						IIf(ADX_Buy,2,0);
						IIf(ADX_bull,1,0);
						//IIf(ADXst,1,0);
	ScoreRank		=	100 * TrendScore / 30;
_SECTION_END();

//////////////////////
// Exploration Code //
//////////////////////
_SECTION_BEGIN("Explorer");
// PARAMETERS
	EXPfil_Parm	=	ParamList	( "Filter","All Symbols|Buy Signals|Sell Signals",0);
	EXPvol_Parm	=	Param		( "20 Day Min. Vol. Cap.", 50000,0,100000000,1000);
	EXPvol_Parm	=	Param		( "Min. Price Close",15,0,5000000,1);
// FILTER
Filter = 1;
// DISPLAY COLUMNS
	//AddColumn	(High52,"52 Week High");
	//AddColumn	(Low52,"52 Week Low");
	AddColumn		(C,"P.Close",1.2,IIf(C>Ref(C,-1),		colorGreen,colorRed));
	AddColumn		(V,"Volume",1,IIf(V>Ref(V,-1),			colorGreen,colorRed));
	AddTextColumn	(VPAv_Status,"VPA Volume",1,			VPAv_Color,BColor_vpa);
	AddTextColumn	(VPAs_Status,"VPA Spread",1,			VPAs_Color,BColor_vpa);
	AddTextColumn	(VPAc_Status,"VPA Close",1,				VPAc_Color,BColor_vpa);
	AddTextColumn	(VPAz_Status,"VPA Zone",1,				VPAz_Color,BColor_vpa);
	AddTextColumn	(VPAst_Status,"VPA Status",1,			VPAst_Color,BColor_vpa);
	AddTextColumn	(EMAs_Status,"EMA Short",1,				EMAs_Color,BColor_mas);
	AddTextColumn	(EMAm_Status,"EMA Mid",1,				EMAm_Color,BColor_mam);
	AddTextColumn	(EMAl_Status,"EMA Long",1,				EMAl_Color,BColor_mal);
	AddTextColumn	(EMAp_Status,"EMA Trend",1,				colorWhite,EMAp_Color);
	AddTextColumn (I_Status,"I Signal",1,					colorWhite,I_Color);
	AddTextColumn (T3_Status,"T3 Signal",1,				colorWhite,T3_Color);
	AddTextColumn	(BB_Status,"Bol. Band",1,				colorWhite,BB_Color);
	AddTextColumn	(MACD_Status,"MACD",1,					colorWhite,MACD_Color);
	AddTextColumn	(RSIt_Status,"MACD(RSI)",1,				colorWhite,RSIt_Color);
	//AddTextColumn	(AROON_Status,"Aroon",1,			colorWhite,AROON_Color);
	//AddTextColumn	(WAD_Status,"Williams A/D",1,		colorWhite,WAD_Color);
	AddTextColumn (COPPOCK_Status,"Coppock",1,			colorWhite,COPPOCK_Color);
	AddTextColumn	(STOCH_Status,"Stochastic",1,			colorWhite,STOCH_Color);
	AddTextColumn	(ARSI_Status,"ARSI",1,					colorWhite,ARSI_Color);
	//AddTextColumn	(RSI_Status,"RSI",1,					colorWhite,RSI_Color);
	AddTextColumn	(MFI_Status,"MFI(14)",1,				colorWhite,MFI_Color);
	AddTextColumn	(ADX_Status,"DMX (ADX)",1,				colorWhite,ADX_Color);
	//AddTextColumn	(ADXc_Status,"ADX Confirm",1,		colorWhite,ADXc_Color);
	//AddColumn		(RSIt,"TEST L",1,						colorWhite,colorBlack);
	AddColumn		(TtD_Change,"P/L %",1.2,IIf(TtD_Change>0,	colorGreen,colorRed));
	AddColumn		(Beta,"( ß )",1.2,IIf(Beta>0,colorGreen,colorRed));
	AddColumn		(ScoreRank,"% Rank",1.0,colorWhite,colorBlue);
_SECTION_END();
20 comments
Leave Comment
Please login here to leave a comment.
Back
Hi Xel,
Good work
But how do I understand ranking…what does it signifies…Please explain it litle bit elaboration
Throwing an unhandled application error with version 5.55.1 and cannot be run.
same proplem i have
Throwing an unhandled application error with version 5.55.1 and cannot be run.
line : 134
x1=IIf(Cloc=0,arg,x);
Dear friend,
this exploration not working properly, i mean showing lot of errors.
pls rectify or explain how to install.
(good work)
thx..
Showing lots of errors
i have no jma-adx
Hi, I do not have Amibroker 5.55.1 but the problem with “x1=IIf(Cloc=0,arg,x);” seems to be related to Volume Price Analysis indicator from Mr. Karthimarar that you can find it here: http://www.wisestocktrader.com/indicators/148-volume-price-analysis-system-vpa-v1-2. Anyway, it seems that you can still (at least in Amibroker 5.40) run the exploration without any big problem. I found that if you change “Cloc=0” to “Cloc==0” the error is not reported by syntax verification.
The “Ranking” is nothing but a count of “Buy Signals” for each indicator based on the “Best possible” or expected “best results” from each one that the exploration found, and if they are true they are counted and calculated in a percentage form.
JMA-ADX are part of the “Plugins” that can be found on "The Foundation 13.00 AFL by Southwind here http://www.wisestocktrader.com/indicators/174-the-foundation-by-southwind-v-13-00-int.
Cheers.
i have tried to download the plugin,but had problem,the web was not exist.could u send me a zipped copy.thx. wangjia0427@gmail.com
Hi Xel,
I have latest version of amibroker & copied required DLL…etc from sothwind system. Still i am getting following error while doing autoanalysis.
where there JSB… related stuff ?
Please give me details so that i can copy them
Thanks
Viswanath
error
=
AmiBroker version 5.50.5.55051
( cooltool.dll 5.50.5, mfc42.dll 6.2.4131, msvcrt.dll 7.0.2600 )
Microsoft Windows XP version 5.1 (Build 2600)
Service Pack 2.0
Common Controls: 6.0
Unhandled exception
ADX_ch = JSB_JDMX(C,ADX_Parm) < JSB_JDMXplus(C,ADX_Parm) AND JSB_JDMX(C,ADX_Parm) < JSB_JDMXminus(C,ADX_Parm); ADX_Buy = Cross(JSB_JDMXplus(C,ADX_Parm), JSB_JDMXminus(C,ADX_Parm)); ADX_Sell = Cross(JSB_JDMXminus(C,ADX_Parm), JSB_JDMXplus(C,ADX_Parm)Type: CSysException
Code: c0000005
Description: ACCESS VIOLATION
Address: 00472A08
^
File: ‘C:\Amibroker\Formulas\Custom\Old TEST1.afl’, Ln: 1304, Col: 69
Error 47.
Exception occurred during AFL formula execution at address: 472A08, code: C0000005
Detailed exception information:
Broker.exe caused an EXCEPTION_ACCESS_VIOLATION in module Broker.exe at 001B:00472A08
//===========
I will post soon next revision (version?) from my Explorer, Hope to fix all problems you feed me Folks and I am adding newer functionality and exploration.
Thanks….
XeL
i am using amibroker 5.50 this afl works well for 15 min. time frame but shows error in other timeframe.
Could this exploration which is good work be fixed by somebody please?
I want this but GETTING ERROR ..×1=IIf(Cloc=0,arg,x);
Pls solve .
@ mlightf
replace ×1=IIf(Cloc=0,arg,x);
with this ×1=IIf(Cloc==0,arg,x);
not working
Sir, This is working excellently. I am using Version5.6. Using this since three days. So far so good.
Thanks a lot,
Dr.Nagaraj
i am using AMIBRO version 5.40 and it is giving error as above mentioned users.
Pls. give AFL absed on 5.40
Thanks A lot..
x1=IIf(Cloc=0,arg,x);
13 line error instead of
pls… help me iam geting error variable adx_bull used without haveing been initialized.(ln:777,col:19)