Stock Portfolio Organizer
The ultimate porfolio management solution.
WiseTrader Toolbox
#1 Selling Amibroker Plugin featuring:
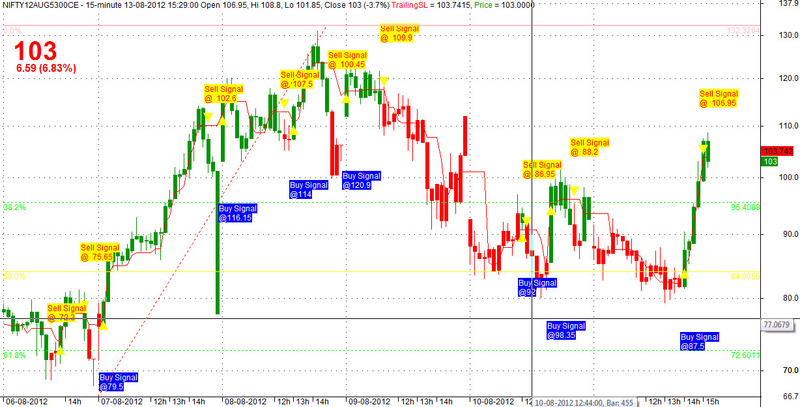
Mk Nifty Options Intraday Trading System for Amibroker (AFL)
More Details http://kanitkar.com/maheshwar/?p=91 or click here
Here is trading plan.
Only Intraday Nifty Options trading and not overnight positions.
Time Frame 15 mins only.
Please plot ema 3 and ema 13 on charts provided by trading software or use popular charting products like Amibroker, Metastock, Metatrader.
Buy rule = EMA 3 crossing EMA 13 from below, means EMA 3 > EMA 13. You can also use SMA 10 on crossover for confirmation.
Stop loss rule = If price is above 60, 5-8% of high of last 3-5 candles, if price is below 60, 5% of of high of last 3-5 candles.
Sell rule = EMA 3 crossing EMA 13 from above, means EMA 3 < EMA 13. ( not needed many times as Profit booking comes before). Remember sell rule may come quite late from top, so you may be giving lot of profits by waiting for sell signal. If market is flat then sell rule will help you to keep in trade as you are trading on 15 min. Always sell below low. There will be many times you will find no new low and so you will stay in trade and can close trades on break even.
Profit booking rule = Trailing profit of 3% from current closing price, once hit exit or Close of current is less than Close of last candle by 3% or more or RSI 21 is above 70 or Fibonacci retracement levels for targets.
Broker – for more than 3 orders a day – use RKSV – monthly fix 1947/- for unlimited trades, unlimited lots, Zerodha for less than 3trades per day – 20 Rs. per order with unlimited lots or 1 lot a day use RKGlobal.
For selecting strikes, look at Nifty spot around 9:30 and select ATM strikes. For more risk and more profits you can select OTMs, if markets move fast, profits will be great.
Always buy above the high of signal bar by 1-2 Rs. (as per your comfort).
Never allow profits turn losses just because sell signal is not there.
Always keep SL in system with acceptable trigger. Remember this is Nifty, one movement on nifty can be of 30 -50 points in 1 min and you will be in deep losses, so never forget to keep SL in system.
Profit booking should ideally happen by trailing SL, which should also be in system. This helps to trail better.
There is nothing about options shorts in this system.
1 min & 5 min TF gives lot of whipsaws, do not try.
If you are using Amibroker then you will see green candle, SL line is drawn at 5%. Please set parameters as you wish. There are sound alerts on buy and sell bars so keep volume at medium level. Candles are colored as per formula and not as per candlestick patterns. On red candle, please sell below low.
If you are using Metastock then please import the formula and expert adviser. Please apply the template and save template one more time. You will find sound alerts, vertical green, red lines for first buy or sell signals. Please set line to bars. Bars are colored as per formula.
Please note you need to have live, Real time or near real time data to trade. Please wait until 9:31 for first trade and close all trades before 3:15 pm.
Be cautious on signals generated on earlier day. You may get green bar / candle but buy above high rule will save you. Also remember options prices dramatically go down even if spot prices do not change as volatility reduced.
15 min TF and SL in system will give you relaxation in trading than stress.
Never trade on expiry day unless you can change body colors in seconds. (like few animals). On events day like RBI policy do not start any trade in morning. Use 1 min TF 15 min before policy event, based on signal take trade.
I will publish kits for Amibroker and Metastock and tutorial soon.
Consistently making money by buying naked options is always difficult.
If you draw HHV and LLV of 9 or 26 period will help you to identify sideways market as these lines will be flat in sideways market. These lines can be similar to Tenkan sen and Kijun sen in Ichimoku Kinko Hyo.
Screenshots
Similar Indicators / Formulas
Indicator / Formula
// MK Options Trader for NIFTY Options.
// By Maheshwar Kanitkar 1-8-2012.
/*

Here is trading plan.
Only Intraday Nifty Options trading and not overnight positions.
Time Frame 15 mins only.
Please plot ema 3 and ema 13 on charts provided by trading software or use popular charting products like Amibroker, Metastock, Metatrader.
Buy rule  = EMA 3 crossing EMA 13 from below, means EMA 3 > EMA 13. You can also use SMA 10 on crossover for confirmation.
Stop loss rule =  If price is above 60, 5-8% of high of last 3-5 candles, if price is below 60, 5% of  of high of last 3-5 candles.
Sell rule = EMA 3 crossing EMA 13 from above, means EMA 3 < EMA 13. ( not needed many times as Profit booking comes before). Remember sell  rule may come quite late from top, so you may be giving lot of profits by waiting for sell signal. If market is flat then sell rule will help you to keep in trade as you are trading on 15 min. Always sell below low. There will be many times you will find no new low and so you will stay in trade and can close trades on break even.
Profit booking rule = Trailing profit of 3% from current closing price, once hit exit or Close of current is less than Close of last candle by 3% or more or RSI 21 is above 70 or Fibonacci retracement levels for targets.
Broker – for more than 3 orders a day – use RKSV – monthly fix 1947/- for unlimited trades, unlimited lots, Zerodha for less than 3trades per day – 20 Rs. per order with unlimited lots or 1 lot a day use RKGlobal.
For selecting strikes, look at Nifty spot around 9:30 and select ATM strikes. For more risk and more profits you can select OTMs, if markets move fast, profits will be great.
Always buy above the high of signal bar by 1-2 Rs. (as per your comfort).
Never allow profits turn losses just because sell signal is not there.
Always keep SL in system with acceptable trigger. Remember this is Nifty, one movement on nifty can be of 30 -50 points in 1 min
and you will be in deep losses, so never forget to keep SL in system.
Profit booking should ideally happen by trailing SL, which should also be in system. This helps to trail better.
There is nothing about options shorts in this system.
1 min & 5 min TF gives lot of whipsaws, do not try.
If you are using Amibroker then you will see green candle, SL line is drawn at 5%. Please set parameters as you wish.
There are sound alerts on buy and sell bars so keep volume at medium level.
Candles are colored as per formula and not as per candlestick patterns. On red candle, please sell below low.
*/
_SECTION_BEGIN("Options Trader");

SetChartOptions(0,chartShowArrows|chartShowDates);
_N(Title = StrFormat("{{NAME}} - {{INTERVAL}} {{DATE}} Open %g, Hi %g, Lo %g, Close %g (%.1f%%) {{VALUES}}", O, H, L, C, SelectedValue( ROC( C, 1 ) ) ));

//STOP LOSS code
//The formula draws a stoploss loss line which will be 2% below the Highest Close within a lookback period of 5 bars.
//You can change these parameters.

lookbackPeriod = Param("Lookback period", 5, 1, 30);
stoplossPercentage = Param("Stoploss Percentage", 3, 2, 10);
TrailingSL= HHV(C,lookbackPeriod) - HHV(C,lookbackPeriod) * (stoplossPercentage / 100) ;
//Plot(HHV(C,lookbackPeriod) - HHV(C,lookbackPeriod) * (stoplossPercentage / 100), "TrailingSL", ParamColor( "Color", colorCycle ));
Plot(TrailingSL, "TrailingSL", ParamColor( "Color", colorCycle ));

// end of stop loss code.

ea = EMA (C,3);
eb = EMA (C,13);
SetBarFillColor( IIf( ea > eb, colorGreen, colorRed ) );
Plot( C, "Price", IIf( ea > eb, colorGreen, colorRed ), styleCandle );
Buy = ea > eb AND TimeNum() > 092000 AND TimeNum() < 150000;
Sell = eb > ea OR TimeNum() > 150000;
Short = 0;
Cover = 0;
Buy = ExRem(Buy,Sell);
Sell = ExRem(Sell,Buy);
Short = ExRem(Short,Cover);
Cover = ExRem(Cover,Short);

// Code to plot signals
dist = 1.5*ATR(10);
for( i = 0; i < BarCount; i++ )
{
if( Buy[i] ) PlotText( "Buy Signal\n@" + C[ i ], i, L[ i ]-dist[i],colorWhite, colorBlue );

if( Sell[i] ) PlotText( "Sell Signal\n@  " + C[ i ], i, H[ i ]+dist[i],colorRed, colorYellow );
//if( Short[i] ) PlotText( "Short\n@" + C[ i ], i, H[ i ]+dist[i], colorRed, colorYellow );
//if( Cover[i] ) PlotText( "Cover\n@" + C[ i ], i, L[ i ]-dist[i],colorGreen );
}
PlotShapes( Buy * shapeUpTriangle + Sell* shapeDownTriangle, IIf( Buy,colorYellow, colorYellow ) );
// PlotShapes( Sell * shapeDownTriangle + Sell * shapeDownTriangle, IIf( Buy,colorGreen, colorRed ) );
// Sound
AlertIf( Buy, "SOUND c:\Windows\Media\chimes.wav", "Buy alert", 2 );
AlertIf( Sell, "SOUND c:\Windows\Media\chimes.wav", "Sell alert", 3 );
// Interpretation Data
// Maheshwar Kanitkar 2012.
printf("Welcome to MK Options Trading system help:\n");
_N( tname = Name()+"("+FullName()+")" );
printf( tname + " has closed " + WriteIf( EMA (Close,3) > EMA (Close,13), "above medium term moving avg, this is Buy signal.\n" , "below medium term moving avg, this is Sell signal.\n" ) + " Follow the trading rules. ");
printf("Trading rules - Buy on Green candle, SL is redline, Once position is in Profit, book profit once prices touches redline, Sell if position goes below redline or Candle becomes red.");

_SECTION_END();
7 comments
Leave Comment
Please login here to leave a comment.
Back
Keep Speakers volume on, so you will hear buy & sell notification sound alerts.
Hi,
Thanks for the AFL, but it gives the error message…:(
Best,
Solo
What error?
Please replace these two lines
The Indicator is giving Error 31 cannot load the AFL inspite of replacing the 2 lines mentioned above request to rectify the error and upload the correct and working AFL. I have sent a mail to you personally too for rectifying the error in the AFL
Replace it by following.
// AlertIf( Buy, “SOUND c:\\Windows\\Media\\chimes.wav”, “Buy alert”, 2 );
// AlertIf( Sell, “SOUND c:\\Windows\\Media\\chimes.wav”, “Sell alert”, 3 );
I have uploaded updated one on my blog, also published performance result.
There is no bug in AFL, the link to media files can be different based on OS installation. I am commenting it.
thank you sir