Stock Portfolio Organizer
The ultimate porfolio management solution.
Shares, Margin, CFD's, Futures and Forex
EOD and Realtime
Dividends and Trust Distributions
And Much More ....
WiseTrader Toolbox
#1 Selling Amibroker Plugin featuring:
Advanced Adaptive Indicators
Advanced Pattern Exploration
Neural Networks
And Much More ....
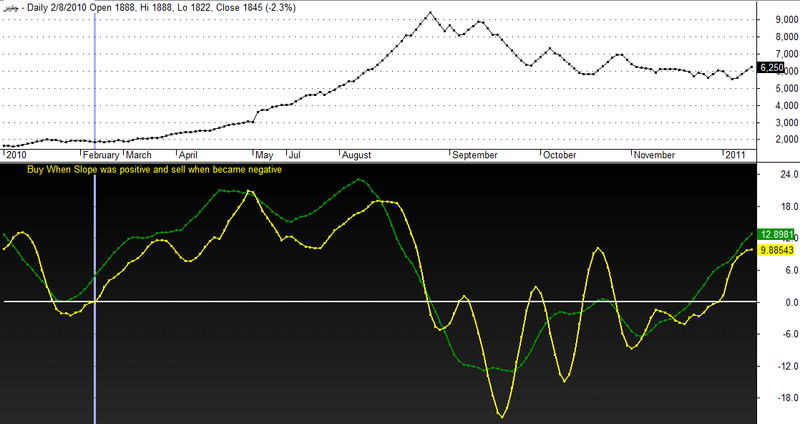
Behgozin Slope Finder for Amibroker (AFL)
Rating:
3 / 5 (Votes 11)
Tags:
amibroker
This is a very simple and useful formula-Simply buy when lines are positive and sell when they became negative- there are 2 lines based on 7 and 15 days- thanks in advance for your good comment
Screenshots
Similar Indicators / Formulas
Kavach Of Karna v2
Submitted
by hbkwarez almost 10 years ago
Advanced Elliott Waves
Submitted
by MarcosEn over 12 years ago
3_6Day GuaiLiLv
Submitted
by motorfly over 12 years ago
Williams Alligator System
Submitted
by durgesh1712 over 12 years ago
*Level Breakout system*
Submitted
by Tinych over 12 years ago
Horizontal Live Priceline Tool
Submitted
by northstar over 12 years ago
Indicator / Formula
Copy & Paste Friendly
SetChartBkGradientFill(1,23);
_SECTION_BEGIN("Behgozin Slope Finder");

Tr2 = Ref(C,1);
Tr3=Ref(C,7);
Trend2 = MA(Tr2,7);
Trend3=MA(Tr3,7);
Slope=((Trend3-Trend2)/Trend3)*100;
Plot(Slope,"Buy When Slope was positive and sell when became negative",colorYellow,styleLine+styleDots|styleThick);
Tr4 = Ref(C,7);
Tr5=Ref(C,15);
Trend3 = MA(Tr4,15);
Trend4=MA(Tr5,15);
Slope=((Trend4-Trend3)/Trend4)*100;
Plot(Slope,"",colorGreen,styleLine+styleDots|styleThick);
Plot(0,"",colorWhite,styleLine);
_SECTION_END();
17 comments
Leave Comment
Please login here to leave a comment.
Back
hi
excellent. gives oppertunity to buy and sell before any indicators . try your self. can some one add alert, buy and sell arrows and explorations for this
ravi
qatar
Its a amazing indicator bro hataro3…simple but great, looking to me exceptional & obviusly leading one.. thanks for nice sharing.
Simply Superb……..
My rating 100
Hotato3, Will this also work any time frame? I mean small Time Frames
Thanks
Viswanath MK
One more clarification required is : Is this forwarding Looking. As per me this is not as no zigzag used. But “shariful” in the above comments saying that it is “obviusly leading one”.
CAn anybody tested on live charts???
Plz update
Thanks
Viswanath
Buy sell signals & exploration added. But its forward looking indicator. Becaefull….
lot of mistakes here for5.50
Dear Friends, Thank you for your comments helping me work harder. unfortunatly this indicator is the second indicator that I tried to generate, in other word I am really unskillful in this field. this indicator has many deficiency as I recognised. Due to its nature of calculation every point by mean value of several points, all points will be re calculated so in some cases that there is abrupt change in price, shift of curve will be clear. and due to this mater please do not consider the value of Slope and consider only its position with respect to zero line. More again I appologize for my poor ability to writing better indicator
Behgozin
dear kv malgi
thanks for the quick response. but the edition of exploration and scan shows lot of syntex errorcan u correct them?i am using 5.0 version of ami
ravi
please be careful before making a decision to sell or buy, you should first be compared to other indicators. I get doubts with this indicator when I do a “bar reply” because the result is always changing.
Ravi, plz use exploration. I am getting results like this below in ami v5.5.
Ticker Date/Time Buy Sell Close High
JSWSTEEL_F1 8/23/2012 16:37:00 1 0 719.500 719.500
SESAGOA_F1 8/23/2012 16:37:00 1 0 191.250 191.250
CNX-IT 8/23/2012 15:33:00 0 1 6207.600 6213.550
RPOWER_F1 8/23/2012 15:30:00 1 0 84.200 84.350
ONGC_F1 8/23/2012 15:30:00 1 0 283.500 283.600
HCLTECH_F1 8/23/2012 15:00:00 0 1 560.650 564.200
INFY_F1 8/23/2012 14:00:00 0 1 2459.000 2467.350
EDUCOMP_F1 8/23/2012 13:00:00 0 1 164.100 164.950
TATAPOWER_F1 8/23/2012 12:59:00 0 1 100.500 100.650
TATASTEEL_F1 8/23/2012 12:00:00 0 1 402.850 403.400
JINDALSTEL_F1 8/23/2012 12:00:00 0 1 411.050 412.700
RCOM_F1 8/23/2012 12:00:00 1 0 53.800 53.800
ICICIBANK_F1 8/23/2012 11:00:00 0 1 984.850 986.600
HINDALCO_F1 8/23/2012 11:00:00 0 1 114.800 115.500
DRREDDY_F1 8/23/2012 11:00:00 0 1 1689.000 1690.500
NIFTY_F2 8/23/2012 11:00:00 0 1 5477.000 5482.450
CNX-DEFTY 8/23/2012 11:00:00 0 1 3413.000 3419.200
MINIFTY_F2 8/23/2012 11:00:00 0 1 5475.150 5481.000
NIFTY_F1 8/23/2012 10:00:00 0 1 5444.000 5453.950
HDFCBANK_F1 8/23/2012 10:00:00 0 1 603.100 606.750
JPASSOCIAT_F1 8/23/2012 10:00:00 0 1 78.250 79.200
CNX500 8/23/2012 10:00:00 0 1 4263.550 4269.100
CNX100 8/23/2012 10:00:00 0 1 5291.050 5300.650
NIFTY 8/23/2012 10:00:00 0 1 5428.500 5439.050
MINIFTY_F1 8/23/2012 10:00:00 0 1 5445.000 5453.950
BANKNIFTY_F2 8/23/2012 10:00:00 0 1 10587.000 10614.000
BANKNIFTY_F1 8/23/2012 10:00:00 0 1 10549.000 10579.000
TITAN_F1 8/23/2012 10:00:00 0 1 225.350 226.800
Dear Kv-Maligi
thank you for your helping to write more for completing my program. Only I must mention that for decision I think it is better to consider only one condition be bigger than zero, ie. only Slope1> 0 and not 2 of them.So please change your program to this condition. I also confirmed that all points will be recalculate every day so shift in curve specially in new days can be happened, but the trend can be understood by watching slope in upper or lower case of zero.
no errors for 5.5 thanks
Hi hotaro3,
Also, I have tried for only slope1 alone, its not reliable. you will be chopped into pieces in choppy market.
You can use following, more reliable.
Use this.
Vishvanath and KV Malgi sir, it is totally useless in live market…………!!!
This afl is of No use … better use Expo moving averages for far better results then wt this alf is giving. Better avoid it
GOOD ONE SIR AND THANKS FOR SHARING
PRASAD
guys ….. this code looks as far as 15 bars into the future ….. I loaded the code and tested it without looking at the code itself and for a moment I felt this fuzzy warm feeling again …. but …. as usual returns like this can not be made in reality (only if you can manipulate the markets like the big banks do). It is easy to check if the code can be traded in real time. Just use the Amibroker playback tool and see how good it will work for you in real time.