Stock Portfolio Organizer
The ultimate porfolio management solution.
WiseTrader Toolbox
#1 Selling Amibroker Plugin featuring:
COMPOSITE INDEX CLOUD STYLE for Amibroker (AFL)
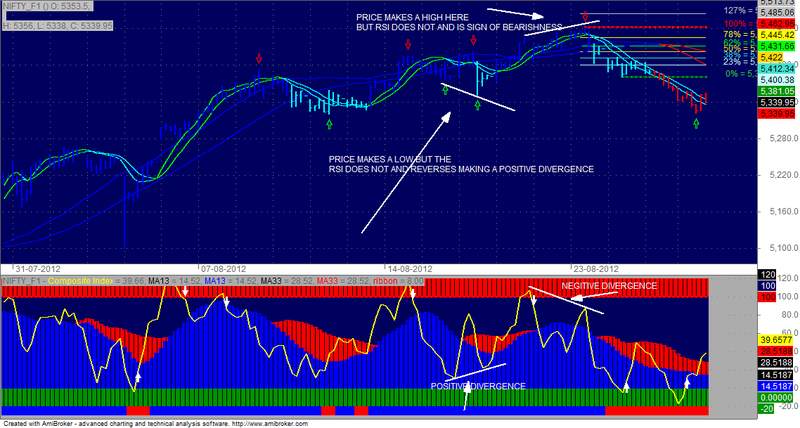
Hi……This is the composite index by Constance brown.I have retained the most famous parameters but provided a cloud style for the same and added a buy and sell signal.I have also added an EOD scan of the stocks in the overbought and oversold region.The red coloured area on top at 100-120 region is overbought and the 0 to -20 is oversold region.It is for traders who trade the divergences.Best time frame is EOD and hourly and short time frame 15min..
I use the composite instead of the regular RSI indicator as it detects and filters the exact spots of divergence better.The cloud style red and blue colour is the horizontal support areas/resistance areas.Hope you enjoy with due credit to Wisestocktrader forum and the master of this amazing afl Constance Brown.
Prasad Muni
Screenshots
Similar Indicators / Formulas
Indicator / Formula
1 2 3 4 5 6 7 8 9 10 11 12 13 14 15 16 17 18 19 20 21 22 23 24 25 26 27 28 29 30 31 32 33 34 35 36 37 38 39 40 41 42 43 44 45 46 47 48 49 50 51 52 53 54 55 56 57 58 59 60 61 62 63 64 65 66 67 | /*Reference to:BreakThroughs in Technical AnalysisKeller, BloombergComposite Index, */A=RSI() - Ref(RSI(),-9)+ MA(RSI(3),3);Plot(A,"Composite Index",colorYellow,styleThick);Plot(MA(A,13),"MA13",colorBlack,styleHistogram);Plot(MA(A,13),"MA13",colorBlue,styleArea);Plot(MA(A,33),"MA33",colorBlack,styleHistogram);Plot(MA(A,33),"MA33",colorRed,styleArea);Plot(100,"",colorRed,styleDots,styleArea);Plot(0,"",colorGreen,styleDots,styleArea);Overbought=100;Oversold=0;Plot(100,"",colorDarkTeal,styleArea);Plot(120,"",colorBlack,styleHistogram);Plot(120,"",colorRed,styleArea);Plot(-20,"",colorBlack,styleHistogram);Plot(-20,"",colorGreen,styleArea);Overbought=100;Oversold=-0; Buy = Cross(A, Oversold) AND A > Oversold;Sell = Cross(Overbought, A) AND A < Overbought;PlotShapes(IIf(Sell, shapeDownArrow , shapeNone), colorWhite);PlotShapes(IIf(Buy, shapeUpArrow , shapeNone), colorWhite);/* Trend Filters */TimeFrameSet(in15Minute);SwingTrd151 = 100 * (Close - ((MA(C,2)+MA(MA(C,2),2)+MA(MA(MA(C,2),2),2) +MA(MA(MA(MA(C,2),2),2),2) +MA(MA(MA(MA(MA(C,2),2),2),2),2) +MA(MA(MA(MA(MA(MA(C,2),2),2),2),2),2) +MA(MA(MA(MA(MA(MA(MA(C,2),2),2),2),2),2),2)+MA(MA(MA(MA(MA(MA(MA(MA(C,2),2),2),2),2),2),2),2)+MA(MA(MA(MA(MA(MA(MA(MA(MA(C,2),2),2),2),2),2),2), 2),2)+MA(MA(MA(MA(MA(MA(MA(MA(MA(MA(C,2),2),2),2),2),2), 2),2),2),2))/10))/(HHV(C,10)-LLV(C,10));SwingTrd152=EMA(SwingTrd151,13);SwingTrd153=EMA(SwingTrd152,13);RMO15= EMA(SwingTrd151,34);Bull_Trend15=EMA(SwingTrd151,34)>0;Bear_Trend15=EMA(SwingTrd151,34)<0;TimeFrameRestore();Ribbon_kol15=IIf(TimeFrameExpand(Bull_Trend15,in15Minute),colorBlue, IIf(TimeFrameExpand(Bear_Trend15,in15Minute),colorRed, colorWhite));Plot(8, "ribbon", Ribbon_kol15, styleOwnScale|styleArea|styleNoLabel, -0.5,100);// End of Trend Filter_SECTION_BEGIN("color1");SetChartBkGradientFill( ParamColor("BgTop", ColorRGB( 172,172,172 )),ParamColor("BgBottom", ColorRGB( 172,172,172 )),ParamColor("titleblock",ColorRGB( 172,172,172 ))); _SECTION_END(); |
11 comments
Leave Comment
Please login here to leave a comment.
Back
Good afl and thnx you for posting it.
nise and good
I love divergence..divergence trading is hidden power of TA…. thanks for valuable sharing bro prasadmuni… hoping we wld get more divergence spoting afl from you…..
This is indeed a very good indicator. Thanks for posting .
Very nice indicator from a great book: “Technical analysis for the trading professional!”
I’m looking for an indicator which plots positive and negative reversals as they occur in the charts…anyone?
I LOVE THIS ONE
Exellant
Hi i just would like to ask if how can i use rsi for 30 periods? thank you
I AM POSTING THE 30 DAY RSI AND LET US WAIT FOR THE ADMINISTRATOR TO POST THE SAME.
THIS FRAME SHOULD BE USED ONLY IN THE BULLION MARKET.GOLD AND SILVER AND IS NOT TO BE USED IN EQUITY MARKET.
Just to let you know, you can find from the website, Composite Index by Constance Brown is claimed to belong to Andrew Cardwell.
She was a student of Andrew Cardwell.
It is called CFG MO (Cardwell Financial Group Momentum Oscillator). Here mentioned the copyright issue:
http://fxcodebase.com/code/viewtopic.php?f=17&t=3007&start=0
Using this code all I get is the Bottom chart? Where is the code for the top chart?
Dick H