Stock Portfolio Organizer
The ultimate porfolio management solution.
WiseTrader Toolbox
#1 Selling Amibroker Plugin featuring:
STD_STK Multi for Amibroker (AFL)
Based on Stochastics this formula delivers quite promising, reliable and consistent results in terms of net profit. Compared with the STD_STK Single this formula will take care of a group of selected tickers/shares. For optimisation my setting are range 120 days. For testing etc. my settings are: commission 0.5%, long only (although long short can be used withour problems), buy and sell on opening next day, max stop loss 3%, and for reporting trade list plus prices. Optimisation requires 729 optimisation steps so be patient if your computer is not the fastest.
I optimise every week for selected tickers.
By Willem Jan – w.j.a.struyck [at] worldonline.nl
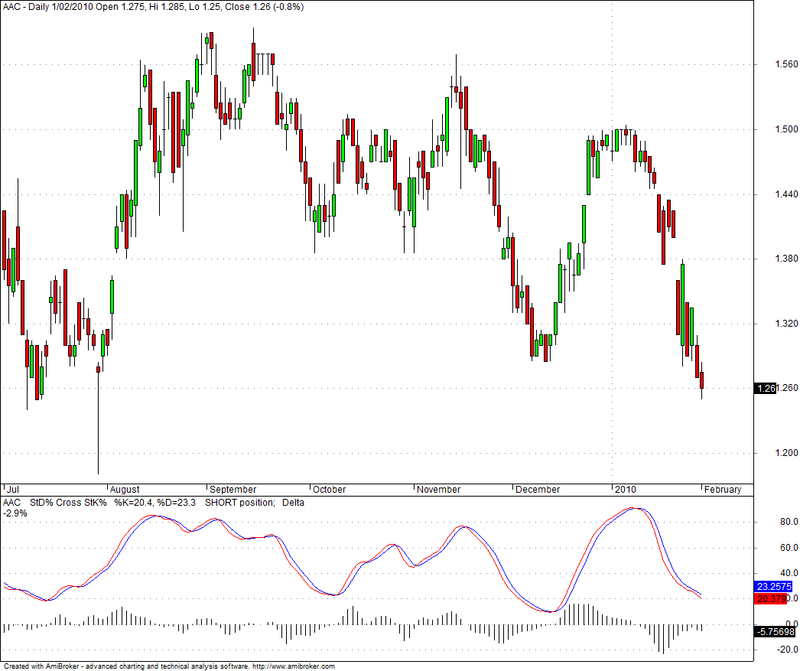
Screenshots
Similar Indicators / Formulas
Indicator / Formula
/*StochK/StochD Crossover for a selctred group of tickers.

//Enters long on stochastic indicator when EMA StochD line crosses the EMA
StochK line. Exit on reversing signals only.

Sequence: To run optimisation remove // in front of lines with optimization
instructions (the 3 lines in the praragraph below) and place // in front of line
with specific STK, STD and pds per ticker (3 lines in 2nd paragraph below). Set
range, click apply to current stock and run optimisation.
Replace the "Stock.." by the tickername you just optimised in all three lines
in the 2nd paragraph. Insert the optimized figures in the ( STK=, STD= AND pds=)
statement of 2nd paragraph below.
Once completed replace // in front of optimization instruction lines (1st
paragraph below), remove // in front of line with specific STK, STD and pds (2nd
paragraph below), save file and click on scan, explore or backtest. These
formulas can also be used as indicator.Adding additional stocks to the list is
simple. Just make certain that by adding a ticker to the list you have to add at
the end one more ).

Each optimisation requires 729 optimisation steps.

1st Paragraph*/

STK=Optimize ("StK" , 14, 2, 18, 2); //*Remove // before STK for optimization,replace for scan, exploration & backtesting.
STD=Optimize ("StD" ,14, 2, 18, 2); //*Remove // before STD for optimization,replace for scan, exploration & backtesting.
pds = Optimize("pds", 9,2,18,2); //*Remove // before pds for optimization,replace for scan, exploration & backtesting.

/*2nd Paragraph*/

//STK= //*Place // in front of STK before optimization, remove for scan,exploration & backtesting.*//
IIf(Name()=="Stock1",8,IIf(Name()=="Stock2",4,IIf(Name()=="Stock3",2,IIf(Name()=="Stock4",2,IIf(Name()=="Stock5",2,
IIf (Name()=="Stock6",14,IIf(Name()=="Stock7",10,0)))))));

//STD= //*Place // in front of STK before optimization, remove for scan,exploration & backtesting.*//
IIf(Name()=="Stock1",8,IIf(Name()=="Stock2",4,IIf(Name()=="Stock3",2,IIf(Name()=="Stock4",2,IIf(Name()=="Stock5",2,
IIf (Name()=="Stock6",14,IIf(Name()=="Stock7",10,0)))))));

//pds= //*Place // in front of STK before optimization, remove for scan,exploration & backtesting.*//
IIf(Name()=="Stock1",8,IIf(Name()=="Stock2",4,IIf(Name()=="Stock3",2,IIf(Name()=="Stock4",2,IIf(Name()=="Stock5",2,
IIf (Name()=="Stock6",14,IIf(Name()=="Stock7",10,0)))))));

STK=LastValue(STK);
STD=LastValue(STD);
pds = LastValue(pds);

Sell= Cross (EMA (StochD (STD),pds),EMA( StochK (STK),pds));
Buy= Cross (EMA(StochK (STK),pds),EMA( StochD (STD),pds));
Cover = Cross (EMA(StochK (STK),pds),EMA( StochD (STD),pds));
Short = Cross (EMA (StochD (STD),pds),EMA( StochK (STK),pds));

Filter=Buy OR Sell OR Short OR Cover;

Buy=ExRem(Buy,Sell); Sell=ExRem(Sell,Buy); Short=ExRem(Short,Cover);
Cover=ExRem(Cover,Short);
NumColumns = 2;
Column0 = EMA( StochK (STK),pds);
Column1 = EMA (StochD (STD),pds);

AddColumn(Buy,"Buy"); AddColumn(Sell,"sell"); AddColumn(Short,"short");
AddColumn(Cover,"cover");

Graph0 = EMA( StochK (STK),pds);
Graph1 = EMA (StochD (STD),pds);
Graph2 = (EMA( StochK (STK),pds) - EMA (StochD (STD),pds))*2;
Graph2Style = 2;
Graph2Color =1;


Title=Name()+"    " +"StD% Cross StK%" + "   "
+"%K="+WriteVal(Graph0,FORMAT=1.1)+", %D="+
WriteVal(Graph1,FORMAT=1.1)+
WriteIf(Graph0>Graph1,"    LONG position"," ")+
WriteIf(Graph1>Graph0,"   SHORT position","")+"; "+ "  Delta" + "
"+WriteVal((Graph2/2),FORMAT=1.1)+"%";
1 comments
Leave Comment
Please login here to leave a comment.
Back
OptimizerSetEngine(“trib”); place into the formula on top the top and it’s be faster optimization with more steps! thanks it’s working in 2 hours time try!on russian stock its very good.