Stock Portfolio Organizer
The ultimate porfolio management solution.
Shares, Margin, CFD's, Futures and Forex
EOD and Realtime
Dividends and Trust Distributions
And Much More ....
WiseTrader Toolbox
#1 Selling Amibroker Plugin featuring:
Advanced Adaptive Indicators
Advanced Pattern Exploration
Neural Networks
And Much More ....
Pivot Levels with good stoploss for Amibroker (AFL)
Rating:
4 / 5 (Votes 10)
Tags:
trading system, amibroker
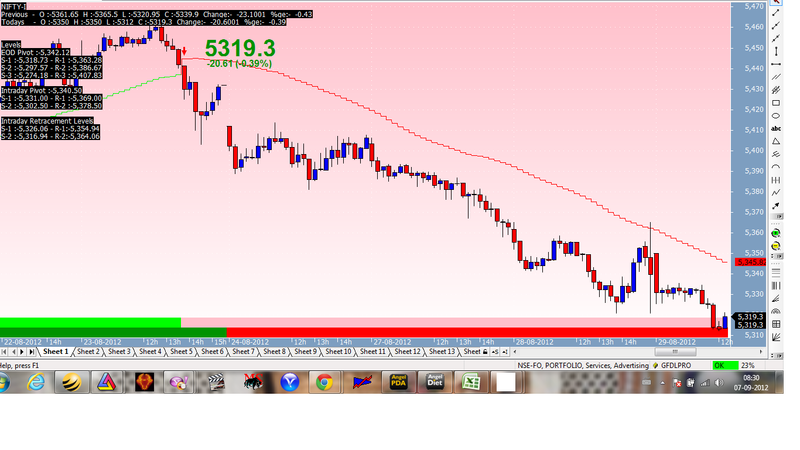
i have made a system with amazing stoploss with buy/sell signals added to the system.
Pivot levels and retracements all provided in the system
Try and give ur comments.
Screenshots
Similar Indicators / Formulas
EMA crossover
Submitted
by Ketan-0 about 13 years ago
Kase Peak Osc. V2 batu
Submitted
by batu1453 almost 10 years ago
Kase CD V2batu
Submitted
by batu1453 almost 10 years ago
Ichimoku
Submitted
by prashantrdx almost 10 years ago
buy and sell two EMAS
Submitted
by mundo0007 about 12 years ago
Adaptive Price Zone (APZ)
Submitted
by AndrewThomas about 13 years ago
Indicator / Formula
Copy & Paste Friendly
_SECTION_BEGIN("Price");
SetChartOptions(0,chartShowArrows|chartShowDates);
_N(Title = StrFormat("{{NAME}} - {{INTERVAL}} {{DATE}} Open %g, Hi %g, Lo %g, Close %g (%.1f%%) {{VALUES}}", O, H, L, C, SelectedValue( ROC( C, 1 ) ) ));
Plot( C, "Close", ParamColor("Color", colorBlack ), styleNoTitle | ParamStyle("Style") | GetPriceStyle() );
_SECTION_END();
_SECTION_BEGIN("Background Color");
BKswitch = ParamToggle("Background Color","On,Off");

OUTcolor = ParamColor("Outer Panel Color",colorLightBlue);
INUPcolor = ParamColor("Inner Panel Upper",colorPink);
INDNcolor = ParamColor("Inner Panel Lower",colorWhite);
TitleColor = ParamColor("Title Color ",colorBlack);

if (NOT BKswitch)
{
SetChartBkColor(OUTcolor); // color of outer border
SetChartBkGradientFill(INUPcolor,INDNcolor,TitleColor); // color of inner panel
}
_SECTION_END();

_SECTION_BEGIN("LEVELS");
PO=TimeFrameGetPrice( "O", inDaily, -1 );
PL=TimeFrameGetPrice( "L", inDaily, -1 );
PH=TimeFrameGetPrice( "H", inDaily, -1 );
PC=TimeFrameGetPrice( "C", inDaily, -1 );
TO= TimeFrameGetPrice( "O", inDaily, 0 );
TH= TimeFrameGetPrice( "H", inDaily, 0 );
TL= TimeFrameGetPrice( "L", inDaily, 0 );
TC= TimeFrameGetPrice( "C", inDaily, 0 );
PC1= TimeFrameGetPrice( "C", inDaily, -2 );

P=((PH+PL+PC)/3);
R1=((2*P)-PL);
S1=((2*P)-PH);
R2=((P-S1)+R1);
S2=(P-(R1-S1));
R3=PH+(2*(P-PL));
S3=PL-(2*(PH-P));

R=TH-TL;
PP=(TH+TL+TO+TO)/4;
RR1=PP+(R*0.38);
RR2=PP+(R*0.62);
SS1=PP-(R*0.38);
SS2=PP-(R*0.62);

PPP=(TH+TL+TO+TO)/4;
RRR1=((2*PPP)-TL);
SSS1=((2*PPP)-TH);
RRR2=((PPP-SSS1)+RRR1);
SSS2=(PPP-(RRR1-SSS1));

Pchange=PC-PC1;
PPerChange=(Pchange/PC1)*100;
Tchange=TC-PC;
TPerChange=(Tchange/TC)*100;

Title=Name()+
"\nPrevious  -  O :-"+PO+"  H :-"+PH+"  L :-"+PL+"  C :-"+PC+"  Change:-  "+Pchange+"  %ge:-  "+WriteVal(PPerChange,1.2)+
"\nTodays    -  O :-"+TO+"  H :-"+TH+"  L :-"+TL+"  C :-"+TC+"  Change:-  "+Tchange+"  %ge:-  "+WriteVal(TPerChange,1.2)+
"\n"+
"\n"+
"\nLevels"+
"\nEOD Pivot :-"+WriteVal(P,1.2)+
"\nS-1 :-"+WriteVal(S1,1.2)+" - R-1 :-"+WriteVal(R1,1.2)+
"\nS-2 :-"+WriteVal(S2,1.2)+" - R-2 :-"+WriteVal(R2,1.2)+
"\nS-3 :-"+WriteVal(S3,1.2)+" - R-3 :-"+WriteVal(R3,1.2)+
"\n"+
"\nIntraday Pivot :-"+WriteVal(PP,1.2)+
"\nS-1 :-"+WriteVal(SSS1,1.2)+" - R-1 :-"+WriteVal(RRR1,1.2)+
"\nS-2 :-"+WriteVal(SSS2,1.2)+" - R-2 :-"+WriteVal(RRR2,1.2)+
"\n"+
"\nIntraday Retracement Levels"+
"\nS-1 :-"+WriteVal(SS1,1.2)+" - R-1:-"+WriteVal(RR1,1.2)+
"\nS-2 :-"+WriteVal(SS2,1.2)+" - R-2:-"+WriteVal(RR2,1.2);
_SECTION_END();
//------------------------------------------------------------------------------


_SECTION_BEGIN("Moving Average");

x=Param("EMA 1",20,1,200,1);
y=Param("EMA 2", 50,1,200,1);
z=Param("EMA 3",100,1,200,1);
zz=Param("EMA 4",200,1,200,1);
EMA20= EMA(C,x);
EMA50=EMA(C,y);
EMA100= EMA(C,z);
EMA200=EMA(C,zz);

SUT=EMA(C,5)>EMA20;
SDT=EMA20>EMA(C,5);
mut= EMA20>EMA50;
mdt=EMA20<EMA50;
_SECTION_END();
_SECTION_BEGIN("Mid Term Price Trend");


MPT = IIf( mut, colorGreen, IIf( mdt, colorRed, colorYellow));
Plot( 3, "", MPT, styleArea|styleOwnScale|styleNoLabel, 0, 100);

_SECTION_END();

_SECTION_BEGIN("Short Term Price Trend");

SPT = IIf( EMA(C,5)>EMA20, colorBrightGreen, IIf( EMA20>EMA(C,5), colorPink, colorYellow));
Plot( 6, "", SPT, styleArea|styleOwnScale|styleNoLabel, 0, 100);

_SECTION_END();

_SECTION_BEGIN("Magnified Market Price");
FS=Param("Font Size",30,30,100,1);
GfxSelectFont("Arial", FS, 700, italic = False, underline = False, True );
GfxSetBkMode( colorGreen );
GfxSetTextColor( ParamColor("Color",colorGreen) );
Hor=Param("Horizontal Position",350,800,800,800);
Ver=Param("Vertical Position",50,27,27,27);
GfxTextOut(""+C,Hor , Ver );
YC=TimeFrameGetPrice("C",inDaily,-1);
DD=Prec(C-YC,2);
xx=Prec((DD/YC)*100,2);
GfxSelectFont("Arial", 12, 700, italic = False, underline = False, True );
GfxSetBkMode( colorGreen );
GfxSetTextColor(ParamColor("Color",colorGreen) );
GfxTextOut(""+DD+" ("+xx+"%)", Hor+5, Ver+45 );
_SECTION_END();

_SECTION_BEGIN("SAM");
/*Gann HiLo*/
per=Optimize("Per",Param("Per",42,1,55,1),1,55,1);

Hld = IIf(C > Ref(MA(H, per), -1), 1, IIf(C < Ref(MA(L, per), -1), -1, 0));
Hlv = ValueWhen(Hld != 0, Hld, 1);
Hilo = IIf(Hlv == -1, MA(H, per), MA(L, per));
Trigger = IIf(C>Hilo, colorCustom9, colorCustom5);
Plot(C,"",1,128);
Plot(Hilo, _DEFAULT_NAME(), Trigger, styleStaircase);
SetPositionSize( 50, spsShares );
Buy=Cross(C,Hilo);
Sell=Cross(Hilo,C);
PlotShapes(IIf(Buy, shapeUpArrow, shapeNone),colorGreen, 0,L, Offset=-25);
PlotShapes(IIf(Sell, shapeDownArrow, shapeNone),colorRed, 0,H, Offset=-25);
_SECTION_END();
14 comments
Leave Comment
Please login here to leave a comment.
Back
Hellow Mr.Anand,
Trend Bands really amazing.
I have put the AFL, but chart is not clear, its compressed.
Any idea how can i get clear normal chart
Thanks
Viswanath
Hi Mr. Kv_Maligi, what do u mean by compressed Afl?? u wish to change the background colour then Visit in Parameter and change the Colour u want.
U can remove the Pivot levels on in black background (Go to Delete indicator – Delete levels ) – Chart would be clear.
Hi,
Its fine now, its a mistake from myside, accidentally i have put trix over it. Now chart is fine.
Thanks
viswanath
very good thnx
@anandnst ,
very good S/L…
if i wish to use this in my other positional formula,can i…?
yes divyesh, u can use this stoploss for entry and exit as positional.its really good one. This Afl is having Scanning also.
very nice thanks anand pls suggest timeframe for intra and positional pls
I have not tested your system but i think it is not correct . Different moving averages work in different time frames . You cant put one period moving average for all time frames . Suppose i am trading short term seeing daily charts . I will put here mov avg which works perfectly in this time frame .We have to change parameters in every time frame .
Kindly test it and then come to the results. i myself is trading on this system daily. i feel its worth in 15 minutes and daily timeframe. Try and would wait for ur comments.
very good…
Hello Mr.Anand,
It is very good, and can u convert mt4 indicators to afl?, if u can give ur mail id.
Hello Vjaisridharan,
R u using MT4 system??
Email address – anandnst@gmail.com
Good One
Good One. How to scan in 15 minutes?