Stock Portfolio Organizer
The ultimate porfolio management solution.
WiseTrader Toolbox
#1 Selling Amibroker Plugin featuring:
Zig-Zag Indicator with Buy/Sell Points for Amibroker (AFL)
Interpreting the Zig-Zag Indicator
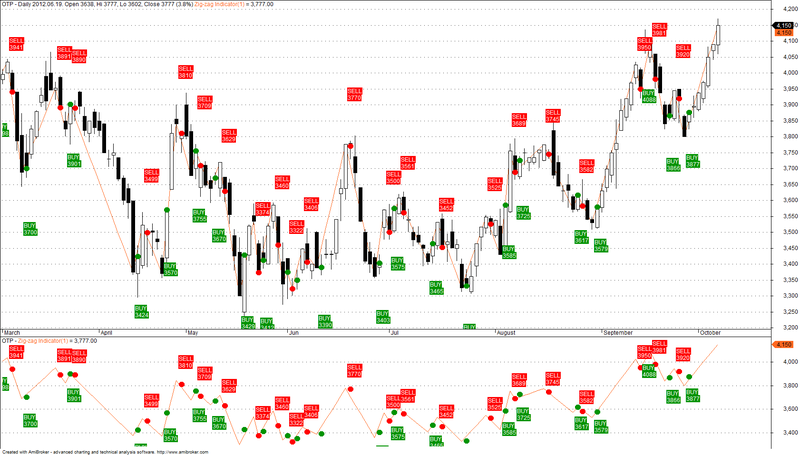
The Zig-Zag indicator is extremely useful for determining price trends, support and resistance areas, and classic chart patterns like head and shoulders, double bottoms and double tops. The Zig-Zag indicators uses both swing highs and swing lows in its calculation:
Swing Highs: When a price (usually close) is both higher than the price previous to it and after it.
Swing Lows: When a price is both lower than the price prior to it and lower than the price following it.
The Zig-Zag indicator can use both percentages or points in its construction. To construct the Zig-Zag indicator, there must be a certain percentage or number of points between a swing high and a swing low before a line will be drawn. The chart below of the E-mini Nasdaq 100 Futures contract visually illustrates the difference between a price retracement Zig-Zag of 3% and a price retracement Zig-Zag of 5%:
Screenshots
Similar Indicators / Formulas
Indicator / Formula
_SECTION_BEGIN("ZIG-ZAG");
Z=Param("zig",1,0,10,0.1);
Plot( z1 = Zig(C,z), "Zig-zag Indicator" + _PARAM_VALUES(), ParamColor("Zig-zag color", colorOrange ), ParamStyle("Zig-zag style") );

Buy = Cover = Zig(C,z)>Ref(Zig(C,z),-1) AND Ref(Zig(C,z),-2)>Ref(Zig(C,z),-1);
Sell = Short = Zig(C,z)<Ref(Zig(C,z),-1) AND Ref(Zig(C,z),-2)<Ref(Zig(C,z),-1);

Buy=ExRem(Buy,Sell);
Sell=ExRem(Sell,Buy);
Short=ExRem(Short,Cover);
Cover=ExRem(Cover,Short);

Filter = Buy OR Sell;

PlotShapes(IIf(Buy, shapeCircle, shapeNone),colorGreen, 0,BuyPrice, 0);
PlotShapes(IIf(Sell, shapeCircle, shapeNone),colorRed, 0,SellPrice, 0);

dist = 1.5*ATR(10);
for( i = 0; i < BarCount; i++ )
{
if( Buy[i] ) PlotText( "BUY\n"+C[ i ], i, BuyPrice[i]-dist[i],colorWhite, colorGreen );
if( Sell[i] ) PlotText( "SELL\n"+C[ i ], i, SellPrice[i]+dist[i],colorWhite, colorRed );
//if( Short[i] ) PlotText( "Short\n@" + C[ i ], i, H[ i ]+dist[i], colorRed, colorYellow );
//if( Cover[i] ) PlotText( "Cover\n@" + C[ i ], i, L[ i ]-dist[i],colorGreen );
}
3 comments
Leave Comment
Please login here to leave a comment.
Back
Thanks
Sudha
Pls give trading method to my mail sornapercula@gmaol.com
Thanks Bro,
its very help full add on to my existing formula