Stock Portfolio Organizer
The ultimate porfolio management solution.
Shares, Margin, CFD's, Futures and Forex
EOD and Realtime
Dividends and Trust Distributions
And Much More ....
WiseTrader Toolbox
#1 Selling Amibroker Plugin featuring:
Advanced Adaptive Indicators
Advanced Pattern Exploration
Neural Networks
And Much More ....
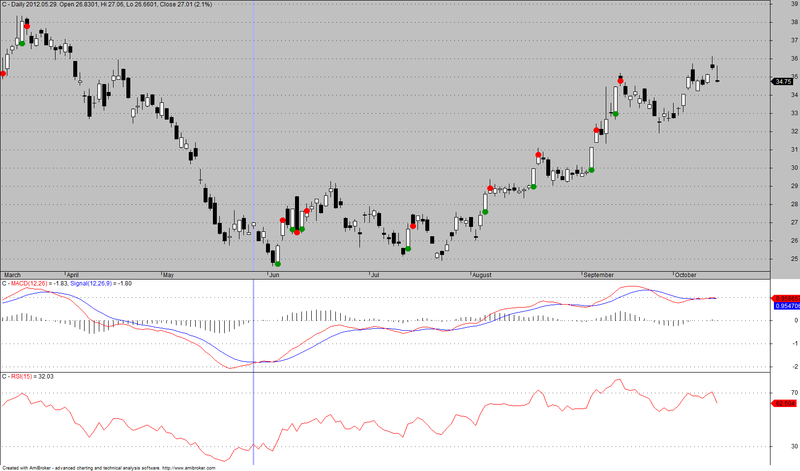
3.3% Next Day System for Amibroker (AFL)
Rating:
3 / 5 (Votes 2)
Tags:
trading system, amibroker
This is a very simple trading system.
Tested and optimized on Dow 30 stocks.
Buy stocks on next day open if price moving between open and close is higher than 3.3%.
And sell next day on BuyPrice+3.3% or on closing price.
Use previous bar equity for position sizing.
Screenshots
Similar Indicators / Formulas
EMA crossover
Submitted
by Ketan-0 about 13 years ago
Kase Peak Osc. V2 batu
Submitted
by batu1453 almost 10 years ago
Kase CD V2batu
Submitted
by batu1453 almost 10 years ago
Ichimoku
Submitted
by prashantrdx almost 10 years ago
buy and sell two EMAS
Submitted
by mundo0007 about 12 years ago
Adaptive Price Zone (APZ)
Submitted
by AndrewThomas about 13 years ago
Indicator / Formula
Copy & Paste Friendly
/*

3.3% Next Day System

This is a very simple trading system.
Tested and optimized on Dow 30 stocks.
Buy stocks if price moving between open and close is higher than 3.3%.
And sell next day on BuyPrice+3.3% or on closing price.
Use previous bar equity for position sizing.

*/

OptimizerSetEngine("cmae"); // you can also use "spso" or "trib" here

// system parameter setup
percent = Optimize("Percent",3.3,1,5,0.1);
percent = (1 + percent/100);

// plot chart

SetChartBkColor(ParamColor("BackGround Color", colorLightGrey));

SetChartOptions(0,chartShowArrows|chartShowDates);
_N(Title = StrFormat("{{NAME}} - {{INTERVAL}} {{DATE}} Open %g, Hi %g, Lo %g, Close %g (%.1f%%) {{VALUES}}", O, H, L, C, SelectedValue( ROC( C, 1 ) ) ));
Plot( C, "Close", ParamColor("Color", colorBlack ), styleNoTitle | ParamStyle("Style") | GetPriceStyle() );

_SECTION_BEGIN("Background text");
C13=Param("fonts",20,10,30,1 );
C14=Param("left-right",2.1,1.0,5.0,0.1 );
C15=Param("up-down",12,1,20,1 );
pxwidth = Status("pxwidth");
pxheight = Status("pxheight");
GfxSetBkMode(transparent=1);
GfxSetOverlayMode(1);
GfxSelectFont("Tahoma", Status("pxheight")/C13 );
GfxSetTextAlign( 6 );
GfxTextOut( Name(), Status("pxwidth")/C14, Status("pxheight")/C15 );
GfxSelectFont("Tahoma", Status("pxheight")/C13*0.9 );
GfxTextOut( "3.3%", Status("pxwidth")/C14, Status("pxheight")/C15*2.5 );
GfxTextOut( "Next Day System", Status("pxwidth")/C14, Status("pxheight")/C15*4 );
GfxSelectFont("Tahoma", Status("pxheight")/C13*0.5 );
GfxTextOut( "", Status("pxwidth")/C14, Status("pxheight")/C15*4 );
GfxSelectFont("MS Sans Serif", 10, 500, False, False, 0);


// the system

Buy = C > O*percent;
//Sell = O<(BuyPrice*percent);
Sell = BuyPrice*percent;

Cover=Buy=ExRem(Buy,Sell);
Short=Sell=ExRem(Sell,Buy);
Short=ExRem(Short,Cover);
Cover=ExRem(Cover,Short);

Filter = Buy OR Sell;

// trade on next day
SetTradeDelays( 1, 1, 1, 1 );
BuyPrice = Open;
SellPrice = BuyPrice*percent;
//ApplyStop( stopTypeProfit, stopModePercent, Optimize( "Profit", 3.3, 2, 30, 1 ), True );

PlotShapes(IIf(Buy, shapeCircle, shapeNone),colorGreen, 0,Open, 0);
PlotShapes(IIf(Sell, shapeCircle, shapeNone),colorRed, 0,Close, 0);
1 comments
Leave Comment
Please login here to leave a comment.
Back
Please provide more detail ,,
How to trade ?
Any article related this theory?