Stock Portfolio Organizer
The ultimate porfolio management solution.
Shares, Margin, CFD's, Futures and Forex
EOD and Realtime
Dividends and Trust Distributions
And Much More ....
WiseTrader Toolbox
#1 Selling Amibroker Plugin featuring:
Advanced Adaptive Indicators
Advanced Pattern Exploration
Neural Networks
And Much More ....
Sini Macd With Price Chart for Amibroker (AFL)
Rating:
4 / 5 (Votes 6)
Tags:
oscillator, trading system, amibroker
Hi Friends,
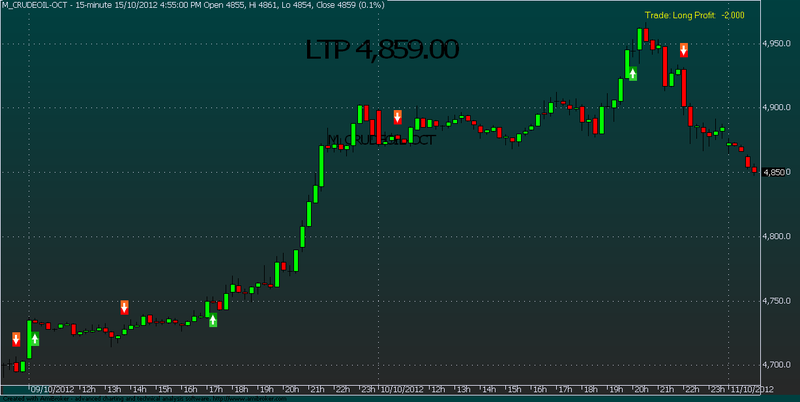
This is just Sini Macd Buy Sell Signals in Price Chart, This AFL usefull to Sini Macd Lovers.
thanks to Sini Macd Creators.
Screenshots
Similar Indicators / Formulas
Rahul Mohindar Oscillator (RMO)
Submitted
by kaiji over 14 years ago
Volatility System
Submitted
by kaiji about 14 years ago
NIFTYTIGER'S MAGIC LINES
Submitted
by niftytiger almost 12 years ago
Zerolag MACD
Submitted
by myth.goa almost 12 years ago
MACD Prediction
Submitted
by EliStern about 13 years ago
MACD MT4/MT5
Submitted
by vivek998877 over 11 years ago
Indicator / Formula
Copy & Paste Friendly
_SECTION_BEGIN("Price");
SetChartOptions(0,chartShowArrows|chartShowDates);
_N(Title = StrFormat("{{NAME}} - {{INTERVAL}} {{DATE}} Open %g, Hi %g, Lo %g, Close %g (%.1f%%) {{VALUES}}", O, H, L, C, SelectedValue( ROC( C, 1 ) ) ));
Plot( C, "Close", ParamColor("Color", colorBlack ), styleNoTitle | ParamStyle("Style") | GetPriceStyle() );
_SECTION_END();

_SECTION_BEGIN("SINI");
r = Param( "SINI period 'R':", 12, 1, 100, 1 );
s = Param( "SINI period 'S':", 26, 1, 100, 1 );
u = Param( "SINI period 'U':", 10, 1, 100, 1 );
sig = Param( "Signal period:", 9, 1, 100, 1 );

Mtm = C - Ref ( C, -1 );
AbsMtm = abs ( Mtm );
Num_T = EMA ( EMA( EMA ( Mtm, r ), s ), u );
Den_T = EMA ( EMA( EMA ( AbsMtm, r ), s ), u);

SINI = 100 * Nz ( Num_T / Den_T );
TSIL = 100 * Nz ( Num_T / Den_T );


//xxxxxxxxxxxxxxxxxxxxxxxxxxxxxxxxxxxxxxxxxxxxxxxxxxxxxxxxxxxxxxxxxxxxxxxxxxxxxxxx

//FORMULA
Cuptop1= C>BBandTop( C,20,1 ) ;
top1up= BBandTop( C,20,1 )>=Ref(BBandTop( C,20,1 ),-1) ;
top2up= BBandTop( C,20,2 )>=Ref(BBandTop( C,20,2 ),-1) ;
MACDup= MACD()>Signal() ;
Hist= MACD()-Signal() ;
Histup= Hist>Ref(Hist,-1) ;
stochup= StochK()>StochD() ;
stoch80= StochK()<80 ;
MFIup= MFI()>EMA(MFI(),5) AND MFI()>20 ;
ma21up= MA(C,21)>=Ref(MA(C,21),-1) ;
ma55up= MA(C,55)>=Ref(MA(C,55),-1) ;
EMA89up= EMA(C,89)>=Ref(EMA(C,89),-1) ;
Cupma21= C>MA(C,21) ;
Cupma55= C>MA(C,55) ;
cupema89= C>EMA(C,89) ;
Vup50= V>50000 ;
CCIup0= CCI()>0 ;
Cupo= C>O ;
//xxxxxxxxxxxxxxxxxxxxxxxxxxxxxxxxxxxxxxxxxxxxxxxxxxxxxxxxxxxxxxxxxxxxxxxxxxxxxxxxxxxxxxxx

mybuy= TSIL > Ref( TSIL, -1 ) AND EMA(SINI,sig) > Ref( EMA(SINI,sig), -1

) AND TSIL>EMA(SINI,sig) AND
macdup AND ema89up AND mfiup ;
mysell= TSIL < Ref( TSIL, -1 ) AND EMA(SINI,sig) < Ref( EMA(SINI,sig), -1

) AND TSIL<EMA(SINI,sig) ;

Buy = ExRem(myBuy, mysell);
Sell = ExRem(mysell, myBuy);

PlotShapes(IIf(Buy, shapeSquare, shapeNone),colorGreen, 0, L, Offset=-20);
PlotShapes(IIf(Buy, shapeSquare, shapeNone),colorLime, 0,L, Offset=-30);
PlotShapes(IIf(Buy, shapeUpArrow, shapeNone),colorWhite, 0,L, Offset=-25);
PlotShapes(IIf(Sell, shapeSquare, shapeNone),colorRed, 0, H, Offset=20);
PlotShapes(IIf(Sell, shapeSquare, shapeNone),colorOrange, 0,H, Offset=30);
PlotShapes(IIf(Sell, shapeDownArrow, shapeNone),colorWhite, 0,H, Offset=-25);

SetPositionSize(300,spsShares);
ApplyStop(0,1,10,1);
//-----------end--------------
Long=Flip(Buy,Sell);
Shrt=Flip(Sell,Buy);

BuyPrice=ValueWhen(Buy,C);
SellPrice=ValueWhen(Sell,C);


Edc=(
WriteIf (Buy AND Ref(shrt,-1), " BUY at "+C+"  ","")+
WriteIf (Sell AND Ref(Long,-1), " SEll at "+C+"  ","")+
WriteIf(Sell , "Last Trade Profit Rs."+(C-BuyPrice)+"","")+
WriteIf(Buy  , "Last trade Profit Rs."+(SellPrice-C)+"","")+
WriteIf(Long AND NOT Buy, "Trade: Long Profit: "+WriteVal((C-BuyPrice))+"","")+
WriteIf(shrt AND NOT Sell, "Trade: Short Profit: "+WriteVal((SellPrice-C))+"",""));

_SECTION_END();

_SECTION_BEGIN("Background text");
C11=ParamColor("up panel",colorDarkOliveGreen );
C12=ParamColor("dn panel",colorDarkGrey );
C13=Param("fonts",20,10,30,1 );
C14=Param("left-right",2.1,1.0,5.0,0.1 );
C15=Param("up-down",12,1,20,1 );
Miny = Status("axisminy");
Maxy = Status("axismaxy");
lvb = Status("lastvisiblebar");
fvb = Status("firstvisiblebar");
pxwidth = Status("pxwidth");
pxheight = Status("pxheight");
GfxSetBkMode( 0 );
GfxSetOverlayMode(1);
GfxGradientRect(0,0,pxwidth, pxheight, C11, C12 );
GfxSelectFont("Tahoma", Status("pxheight")/C13 );
GfxSetTextAlign( 6 );
GfxTextOut( "LTP "+WriteVal(C,1.2), Status("pxwidth")/C14, Status("pxheight")/C15);
GfxSelectFont("Tahoma", Status("pxheight")/C13*0.5 );
GfxTextOut( Name(), Status("pxwidth")/C14, Status("pxheight")/C15*4 );
GfxSelectFont("MS Sans Serif", 10, 500, False, False, 0);
GfxSetTextColor(colorYellow);
GfxTextOut(""+edc+"", Status("pxwidth")/1.15, Status("pxheight")/C15*0.3 );


_SECTION_END();
4 comments
Leave Comment
Please login here to leave a comment.
Back
Hello Murali,
Thnx you for plotting buy-sell arrows or signals on price chart Of Macd. Now its easy to Backtest too. i will soon.
Thnx you again.
Regards
Anand
Thanks u for using SINI MACD. You can extend signal period to 10 in order to avoid false signals.
Thanks again.
ok, thank u sir
Thank you sir. Good Afl.