Stock Portfolio Organizer
The ultimate porfolio management solution.
Shares, Margin, CFD's, Futures and Forex
EOD and Realtime
Dividends and Trust Distributions
And Much More ....
WiseTrader Toolbox
#1 Selling Amibroker Plugin featuring:
Advanced Adaptive Indicators
Advanced Pattern Exploration
Neural Networks
And Much More ....
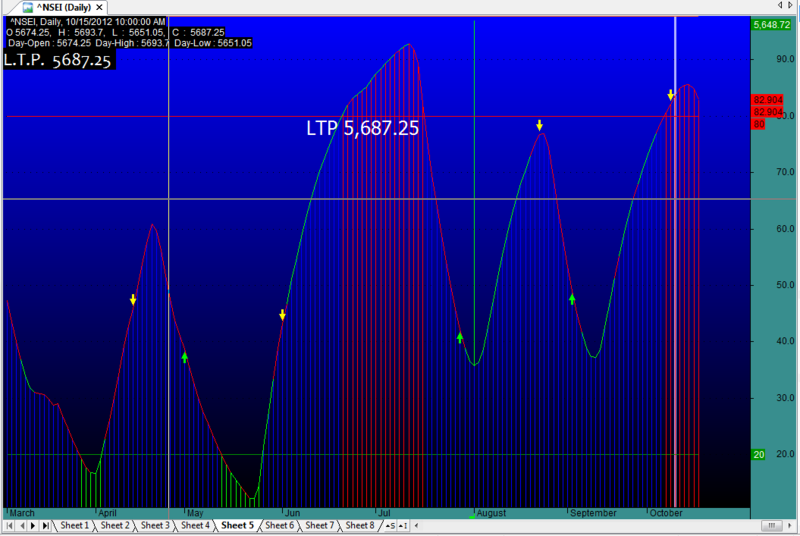
wise trend indicator for Amibroker (AFL)
Rating:
3 / 5 (Votes 2)
Tags:
oscillator, trading system, amibroker
wise trend indicator with buy sell arrow and audio alert and screener…
and ob,os line option…
Screenshots
Similar Indicators / Formulas
Rahul Mohindar Oscillator (RMO)
Submitted
by kaiji over 14 years ago
Volatility System
Submitted
by kaiji about 14 years ago
NIFTYTIGER'S MAGIC LINES
Submitted
by niftytiger almost 12 years ago
Zerolag MACD
Submitted
by myth.goa over 11 years ago
MACD Prediction
Submitted
by EliStern about 13 years ago
MACD MT4/MT5
Submitted
by vivek998877 over 11 years ago
Indicator / Formula
Copy & Paste Friendly
Slw = 24;  Pds = 12;
Slw  = Param( "Slw", 24 );
Pds= Param( " Pds", 12 );
R = ((HHV(H,60) - C) /(HHV (H,60) -LLV (L,60))) *-100;
Period = 10;
EMA1 = EMA(R,Period);
EMA2 = EMA(EMA1,5);
se = EMA1 - EMA2;
ni = EMA1 + se;
PR = 0-abs(ni);
ra = MA(PR,5);

na = PR>=ra AND PR>=Ref(PR,-1) ;
tu = (PR < ra) OR PR>= ra AND PR< Ref(PR,-1) ;

barcolor = IIf( tu,colorRed, IIf( na, colorBrightGreen, 7));

Graph0BarColor = ValueWhen( barcolor != 0, barcolor );

A = EMA((Close-LLV(Low,Pds))/(HHV(H,pds)-LLV(L,Pds)),Slw)*100;


DSS = EMA((A-LLV(A,pds))/(HHV(A,Pds)-LLV(A,Pds)),Slw)*100;

MaxGraph = 10;
Graph0 = DSS; Graph0Color = 6;    Graph2 = DSS;
Overbought = 80;  Oversold =  20;

Graph2BarColor = IIf (Graph2 > overbought, 4,
                                   IIf (Graph2 < oversold,5,6));
pds=10;
MAs = MA ( C,2);
MAf = MA ( C,2);
pds=MAf;
pds=MAs;
Sell =  Cross( MAs, MAf );
Buy = Cross( MAf,MAs );
Short=Sell;
Cover=Buy;


Sell= Cross (DSS, A);
Buy = Cross (A,DSS);
Cover=Buy;
Short=Sell;
Buy=ExRem(Buy,Sell);
Sell=ExRem(Sell,Buy);

_SECTION_BEGIN("Title");

DODay = TimeFrameGetPrice("O", inDaily);
DHiDay = TimeFrameGetPrice("H", inDaily);
DLoDay = TimeFrameGetPrice("L", inDaily);
Title = EncodeColor(colorWhite)+"  "+EncodeColor(colorWhite)+ Name() + ", " + Interval(2) + ", " + Date() +
EncodeColor(colorWhite)   +  "\nO " + EncodeColor(colorWhite) + O +

 ",   H :  "   + H +
 ",   L  :  " + L +
 ",   C  :  "  + C +
EncodeColor(colorWhite)+ "\n Day-Open : " +DODay + "  Day-High : " +DHiDay + "  Day-Low : " + DLoDay +
EncodeColor(colorLime)+
WriteIf (Buy , " GO LONG / Reverse Signal at "+C+"  ","")+
WriteIf (Sell , " EXIT LONG / Reverse Signal at "+C+"  ","")+"\n"+EncodeColor(colorYellow)+
WriteIf(Buy, "Total Profit/Loss for the Last Trade Rs."+(C-BuyPrice)+"","")+
WriteIf(Sell  , "Total Profit/Loss for the Last trade Rs."+(SellPrice-C)+"","");


ob = 80; /*Overbought */
/*ob = Optimize("ob",83,65,88,1); */
os = 20; /*Oversold */
/*os = Optimize("os",24,20,50,1); */

Plot(Ob,"Overbought Level",colorRed, styleLine);
Plot(Os,"Oversold Level",colorGreen, styleLine);
Plot( Volume, _DEFAULT_NAME(), ParamColor("Color", colorLavender ), styleNoTitle | ParamStyle( "Style", styleHistogram | styleOwnScale | styleThick | styleNoLabel, maskHistogram  ), 2 );

_SECTION_BEGIN("L.T.P.");
cx = Param( "cxposn", 0, 0, 1250, 1 );
cy = Param( "cyposn", 42, 0, 500, 1 );
GfxSelectFont( "Candara", 18, 98, False );
GfxSetBkColor( colorBlack );
GfxSetTextColor( colorWhite );
GfxTextOut( "L.T.P.  " + C + " ", cx, cy );

AlertIf( Buy , "SOUND C:\\Windows\\Media\\chimes.wav", "Audio alert", 2 );
AlertIf( Sell , "SOUND C:\\Windows\\Media\\alert.wav", "Audio alert", 2 );
PlotShapes( Buy * shapeUpArrow + Sell * shapeDownArrow, IIf( Buy, colorBrightGreen, colorYellow ) );
BI = BarIndex();
SelectedBar = SelectedValue(BI) -BI[0];
//Selectedbar = Status("lastvisiblebar")-1;
PStr="";
for(Cp=0; Cp<=44; Cp++)
	{
	Temp = VarGet("Pattern"+NumToStr(Cp,1.0));
	if(temp[SelectedBar]) Pstr=Pstr+"#"+NumToStr(Cp,1.0)+" - "+StrExtract(PatternNameList,Cp)+"\n";
	}
FS=Param("Font Size",11,11,100,1);
GfxSelectFont("Times New Roman", FS, 700, True );
GfxSetBkMode( colorWhite );
GfxSetTextColor( ParamColor("Color",colorWhite) );
Hor=Param("Horizontal Position",237,1,1200,1);
Ver=Param("Vertical Position",50,1,830,1);


SetChartOptions( 1, chartShowDates );
BKswitch = ParamToggle("Background Color","On,Off");

OUTcolor = ParamColor("Outer Panel Color",colorTeal);
INUPcolor = ParamColor("Inner Panel Upper",colorBlue);
INDNcolor = ParamColor("Inner Panel Lower",colorBlack);
TitleColor = ParamColor("Title Color ",colorBlack);

if (NOT BKswitch)
{
SetChartBkColor(OUTcolor); // color of outer border
SetChartBkGradientFill(INUPcolor,INDNcolor,TitleColor); // color of inner panel
}


H1=SelectedValue( TimeFrameGetPrice( "H", inDaily, -1 ));
L1=SelectedValue(TimeFrameGetPrice( "L", inDaily, -1 ));
C1=SelectedValue(TimeFrameGetPrice( "C", inDaily, -1 ));

PP= (H1 + L1 + C1)/3;
High1=((((C1 + H1)/2)/3)*2) + (O /3) ;
Low1 = ((((C1 + L1)/2)/3)*2) + (O /3) ;

High2= High1 + (High1- Low1);
Low2 = Low1 - (High1- Low1);

Plot (PP,"Pivot",colorOrange,styleLine+styleNoRescale);
Plot (High1,"H1",colorRed,styleLine|styleNoRescale);
Plot (High2,"H2",colorRed,styleLine|styleNoRescale);

Plot (Low1,"L1",colorGreen,styleLine|styleNoRescale);
Plot (Low2,"L2",colorGreen,styleLine|styleNoRescale);

C13=Param("fonts",8,32,50,1 );
C14=Param("left-right",2.2,1.0,5.0,0.1 );
C15=Param("up-down",5,1,30,1 );
GfxSelectFont("Tahoma", Status("pxheight")/C13 );
GfxSetTextAlign( 6 );
GfxTextOut( "LTP "+WriteVal(C,1.2), Status("pxwidth")/C14, Status("pxheight")/C15);
GfxSelectFont("Tahoma", Status("pxheight")/C13*0.5 );
1 comments
Leave Comment
Please login here to leave a comment.
Back
This is one type of RSI…Given in wisestocktrader (Smooth Rsi).
http://wisestocktrader.com/indicators/2774-smooth-rsi
Modification is done… n its good.More explanation needed on Red Shadow part. It shows top formation??