Stock Portfolio Organizer
The ultimate porfolio management solution.
Shares, Margin, CFD's, Futures and Forex
EOD and Realtime
Dividends and Trust Distributions
And Much More ....
WiseTrader Toolbox
#1 Selling Amibroker Plugin featuring:
Advanced Adaptive Indicators
Advanced Pattern Exploration
Neural Networks
And Much More ....
TA BHAI AFL for Amibroker (AFL)
Rating:
4 / 5 (Votes 5)
Tags:
trading system, amibroker
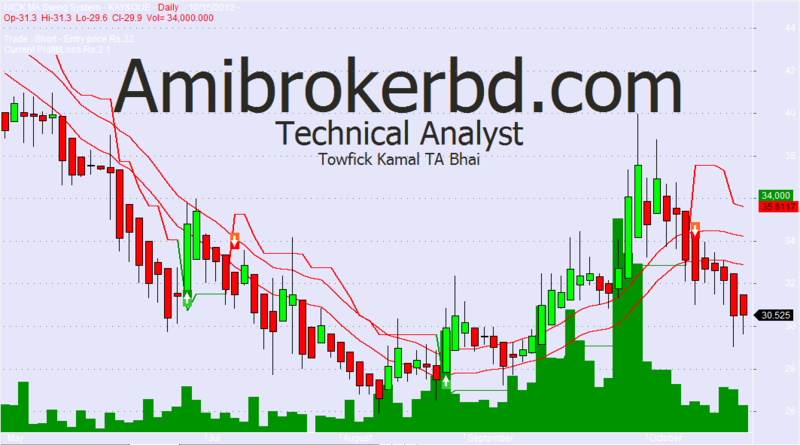
Popular technical analyst Towfick Kamal aka TA Bhai makes usage of percentage band ,Hiekinashi and volume in 1 chart to display a good trend cathing indicator/ trading system. Based on NMA SWING SYSTEM.
Buy when price cross Percentage band and hiekinashi triggers a buy signal with volume bars greater then average volume bars
Works in Dhaka stock exchange and chittagong stock exchange
tested in amibroker 5.5Screenshots
Similar Indicators / Formulas
EMA crossover
Submitted
by Ketan-0 about 13 years ago
Kase Peak Osc. V2 batu
Submitted
by batu1453 almost 10 years ago
Kase CD V2batu
Submitted
by batu1453 almost 10 years ago
Ichimoku
Submitted
by prashantrdx almost 10 years ago
buy and sell two EMAS
Submitted
by mundo0007 about 12 years ago
Adaptive Price Zone (APZ)
Submitted
by AndrewThomas about 13 years ago
Indicator / Formula
Copy & Paste Friendly
_SECTION_BEGIN("Name");
GfxSetOverlayMode(1);
GfxSelectFont("Tahoma", Status("pxheight")/8 );
GfxSetTextAlign( 6 );// center alignment
GfxSetTextColor( ColorHSB( 42, 42, 42 ) );
GfxSetBkMode(0); // transparent
GfxTextOut( "Amibrokerbd.com", Status("pxwidth")/2, Status("pxheight")/12 );
GfxSelectFont("Tahoma", Status("pxheight")/18 );
GfxTextOut( "Technical Analyst", Status("pxwidth")/2, Status("pxheight")/4 );

GfxSelectFont("Tahoma", Status("pxheight")/18 );
GfxSelectFont("Tahoma", Status("pxheight")/36 );
GfxTextOut( "Towfick Kamal TA Bhai", Status("pxwidth")/2, Status("pxheight")/3 );
_SECTION_END();

_SECTION_BEGIN("NMA Swing Explorer");
SetBarsRequired(200,0);

GraphXSpace = 5;
SetChartOptions(0,chartShowArrows|chartShowDates);
k =  Optimize("K",Param("K",2,0.25,5,0.25),0.25,5,0.25);
Per= Optimize("atr",Param("atr",20,3,20,1),3,20,1);
HACLOSE=(O+H+L+C)/4;
HaOpen = AMA( Ref( HaClose,  -1 ),  0.5 );
HaHigh = Max( H,  Max( HaClose,  HaOpen ) );
HaLow = Min( L,  Min( HaClose,  HaOpen ) );
if( ParamToggle("Plot Heikin-Ashi", "No,Yes", 1 ) )
   PlotOHLC( HaOpen, HaHigh, HaLow, HaClose, "Heikin Ashi " + Name(), colorBlack, styleCandle );
else
 Plot( C, "Regular candles " + Name(), colorBlack, styleCandle );
j=Haclose;

//=======================================================================================================================
//=========================Indicator==============================================================================================
f=ATR(15);

rfsctor = WMA(H-L, Per);

revers = k * rfsctor;

Trend = 1;
NW[0] = 0;


for(i = 1; i < BarCount; i++)
{
 if(Trend[i-1] == 1)
 {
  if(j[i] < NW[i-1])
  {
   Trend[i] = -1;
   NW[i] = j[i] + Revers[i];
  }
  else
  {
   Trend[i] = 1;
   if((j[i] - Revers[i]) > NW[i-1])
   {
    NW[i] = j[i] - Revers[i];
   }
   else
   {
    NW[i] = NW[i-1];
   }
  }
 }
 if(Trend[i-1] == -1)
 {
  if(j[i] > NW[i-1])
  {
   Trend[i] = 1;
   NW[i] = j[i] - Revers[i];
  }
  else
  {
   Trend[i] = -1;
   if((j[i] + Revers[i]) < NW[i-1])
   {
    NW[i] = j[i] + Revers[i];
   }
   else
   {
    NW[i] = NW[i-1];
   }
  }
 }
}

//===============system================

Plot(NW, "", IIf(Trend == 1, 27, 4), 4);
Buy=Cover=Cross(j,nw);
Sell=Short=Cross(nw,j);
SellPrice=ValueWhen(Sell,C,1);
BuyPrice=ValueWhen(Buy,C,1);
Long=Flip(Buy,Sell);
Shrt=Flip(Sell,Buy );
NMAB= NW<HACLOSE;
NMAS= NW>HACLOSE;

NMA_status= WriteIf(NMAB, "BUY MODE", WriteIf(NMAS, "SELL MODE", "NEUTRAL"));
NMAS_Col=IIf(NMAB, colorGreen, IIf(NMAS, colorRed, colorLightGrey));
Filter=1;
AddColumn( NW[BarCount-1], "SAR", 1.2 );
AddColumn( HACLOSE, "HA Close", 1.2 );
AddColumn( C, "Close", 1.2 );
AddTextColumn(NMA_status, "MODE", 1, colorWhite, NMAS_Col);
_SECTION_END();
//=================TITLE================================================================================================
_SECTION_BEGIN("Title");
if( Status("action") == actionIndicator )
(
Title = EncodeColor(colorWhite)+ "NICK MA Swing System" + " - " +  Name() + " - " + EncodeColor(colorRed)+ Interval(2) + EncodeColor(colorWhite) +
 "  - " + Date() +" - "+"\n" +EncodeColor(colorRed) +"Op-"+O+"  "+"Hi-"+H+"  "+"Lo-"+L+"  "+
"Cl-"+C+"  "+ "Vol= "+ WriteVal(V)+"\n"+
EncodeColor(colorLime)+
WriteIf (Buy , " GO LONG / Reverse Signal at "+C+"  ","")+
WriteIf (Sell , " EXIT LONG / Reverse Signal at "+C+"  ","")+"\n"+EncodeColor(colorWhite)+
WriteIf(Sell , "Total Profit/Loss for the Last Trade Rs."+(C-BuyPrice)+"","")+
WriteIf(Buy  , "Total Profit/Loss for the Last trade Rs."+(SellPrice-C)+"","")+
WriteIf(Long AND NOT Buy, "Trade : Long - Entry price Rs."+(BuyPrice),"")+
WriteIf(shrt AND NOT Sell, "Trade : Short - Entry price Rs."+(SellPrice),"")+"\n"+
WriteIf(Long AND NOT Buy, "Current Profit/Loss Rs."+(C-BuyPrice)+"","")+
WriteIf(shrt AND NOT Sell, "Current Profit/Loss Rs."+(SellPrice-C)+"",""));
PlotShapes(IIf(Buy, shapeSquare, shapeNone),colorGreen, 0, L, Offset=-40);
PlotShapes(IIf(Buy, shapeSquare, shapeNone),colorLime, 0,L, Offset=-50);
PlotShapes(IIf(Buy, shapeUpArrow, shapeNone),colorWhite, 0,L, Offset=-45);
PlotShapes(IIf(Sell, shapeSquare, shapeNone),colorRed, 0, H, Offset=40);
PlotShapes(IIf(Sell, shapeSquare, shapeNone),colorOrange, 0,H, Offset=50);
PlotShapes(IIf(Sell, shapeDownArrow, shapeNone),colorWhite, 0,H, Offset=-45);
_SECTION_END();

_SECTION_BEGIN("Percent Bands");
P = ParamField("Price field",-1);
Periods = Param("Periods", 15, 2, 300, 1 );
Width = Param("Width%", 2, 0, 10, 0.05 );
Color = ParamColor("Color", colorCycle );
Style = ParamStyle("Style", styleLine | styleNoLabel | styleThick );
CenterLine = MA( P, Periods );
Plot( (1 + Width * 0.01) * CenterLine, "%EnvTop" + _PARAM_VALUES(), Color, Style );
Plot( (1 - Width * 0.01) * CenterLine, "%EnvBot" + _PARAM_VALUES(), Color, Style );
_SECTION_END();
_SECTION_BEGIN("Volume");
Plot( Volume, _DEFAULT_NAME(), ParamColor("Color", colorGreen ), ParamStyle( "Style", styleArea | styleHistogram | styleOwnScale | styleThick, maskHistogram  ), 2 );
_SECTION_END();
5 comments
Leave Comment
Please login here to leave a comment.
Back
so easy way to find out a trend. thanks creator :)
This formula is nick MA system
All are older codes.
Bogus !
Mr. Polash you saying “All are older codes.Bogus !” But I know technical analyst Towfick Kamal . He is the king of Technical Analysis of Bangladesh!!!!?(obviously self declared)Look his wordings he uses in this post" Popular technical analyst Towfick Kamal aka TA Bhai makes usage…" I never came across any popular personality who addressing himself as popular!!!! Even I wonder whether this popular King of TA knows copy + paste properly!! He made this for Bangladeshis but currency showing in his chart as Rs. instead of Taka…!!!!!
Yes Mr. Shariful, by the way of his writings….it is proved that he has no ability to write a single line of AFL code. He is a self-declared TA, no doubt.