Stock Portfolio Organizer
The ultimate porfolio management solution.
Shares, Margin, CFD's, Futures and Forex
EOD and Realtime
Dividends and Trust Distributions
And Much More ....
WiseTrader Toolbox
#1 Selling Amibroker Plugin featuring:
Advanced Adaptive Indicators
Advanced Pattern Exploration
Neural Networks
And Much More ....
Intraday Trading for Amibroker (AFL)
Rating:
4 / 5 (Votes 4)
Tags:
trading system, amibroker
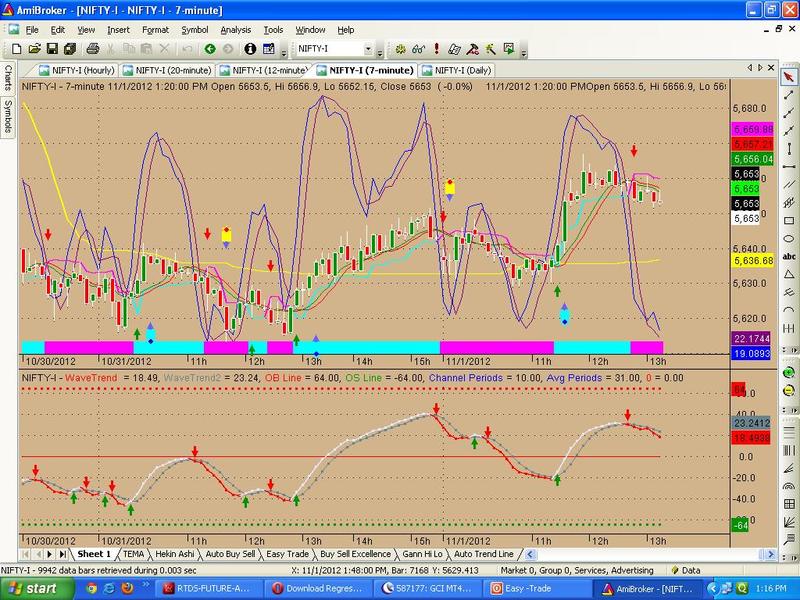
Buy = Green Average Line should be above Red Average Line and Mike Oscillator should be below Zoro Line and Giving Buy Arrow, Moreover Stochastic on Price should be in Over Sold Zone.
Sell = Exactly Vise – a – Versa
Screenshots
Similar Indicators / Formulas
EMA crossover
Submitted
by Ketan-0 about 13 years ago
Kase Peak Osc. V2 batu
Submitted
by batu1453 over 9 years ago
Kase CD V2batu
Submitted
by batu1453 over 9 years ago
Ichimoku
Submitted
by prashantrdx almost 10 years ago
buy and sell two EMAS
Submitted
by mundo0007 about 12 years ago
Adaptive Price Zone (APZ)
Submitted
by AndrewThomas about 13 years ago
Indicator / Formula
Copy & Paste Friendly
// developed by amibrokerfans
_SECTION_BEGIN("Chart Settings");
SetChartOptions(0,chartShowArrows|chartShowDates);
SetChartBkColor(ParamColor("Outer Panel",colorPaleBlue));
SetChartBkGradientFill(ParamColor("Upper Chart",1),ParamColor("Lower Chart",23));
GraphXSpace=Param("GraphXSpace",10,0,100,1);
dec = (Param("Decimals",2,0,7,1)/10)+1;
bi = BarIndex();
Lbi = LastValue(BarIndex());
sbi = SelectedValue(bi);
x1= BarCount-1;
_SECTION_END();

_SECTION_BEGIN("theswing");
SetBarsRequired(200,0);
GraphXSpace = 5;
SetChartOptions(0,chartShowArrows|chartShowDates);
a = 2;
b= 20;
HACLOSE=(O+H+L+C)/4;
HaOpen = AMA( Ref( HaClose, -1 ), 0.5 );
HaHigh = Max( H, Max( HaClose, HaOpen ) );
HaLow = Min( L, Min( HaClose, HaOpen ) );
d=Haclose;
e=ATR(14);
g = WMA(H-L,b);
k = a * g;
m = 1;
n[0] = 0;
for(i = 1; i < BarCount; i++)
{
if(m[i-1] == 1)
{
if(d[i] < n[i-1])
{
m[i] = -1;
n[i] = d[i] + k[i];
}
else
{
m[i] = 1;
if((d[i] - k[i]) > n[i-1])
{
n[i] = d[i] - k[i];
}
else
{
n[i] = n[i-1];
}
}
}
if(m[i-1] == -1)
{
if(d[i] > n[i-1])
{
m[i] = 1;
n[i] = d[i] - k[i];
}
else
{
m[i] = -1;
if((d[i] + k[i]) < n[i-1])
{
n[i] = d[i] + k[i];
}
else
{
n[i] = n[i-1];
}
}
}
}
Buy=Cover=Cross(d,n);
Sell=Short=Cross(n,d);
SellPrice=ValueWhen(Sell,C,1);
BuyPrice=ValueWhen(Buy,C,1);
Long=Flip(Buy,Sell);
Shrt=Flip(Sell,Buy );
_SECTION_END();
_SECTION_BEGIN("Title");
z = (GetPerformanceCounter()/200)%255;
anim=ColorHSB( ( i + z ) % 256, 155, 250 );
RequestTimedRefresh(1);
if( Status("action") == actionIndicator )
(
Title = EncodeColor(colorWhite) + Name() + " - " + EncodeColor(colorRed)+ Interval(2) + EncodeColor(colorWhite) +
" - " + Date() +" - "+"\n" +EncodeColor(colorWhite) +"Op-"+O+" "+"Hi-"+H+" "+"Lo-"+L+" "+
"Cl-"+C+" "+ "Vol= "+ WriteVal(V)+"\n"+
EncodeColor(colorRed)+
WriteIf (Buy , " GO LONG / Reverse Signal at "+C+" ","")+
WriteIf (Sell , " EXIT LONG / Reverse Signal at "+C+" ","")+"\n"+EncodeColor(colorWhite)+
WriteIf(Sell , "Total Profit/Loss for the Last Trade Rs."+(C-BuyPrice)+"","")+
WriteIf(Buy , "Total Profit/Loss for the Last trade Rs."+(SellPrice-C)+"","")+
WriteIf(Long AND NOT Buy, "Trade : Long - Entry price Rs."+(BuyPrice),"")+
WriteIf(shrt AND NOT Sell, "Trade : Short - Entry price Rs."+(SellPrice),"")+"\n"+
WriteIf(Long AND NOT Buy, "Current Profit/Loss Rs."+(C-BuyPrice)+"","")+
WriteIf(shrt AND NOT Sell, "Current Profit/Loss Rs."+(SellPrice-C)+"",""));
PlotShapes(IIf(Buy, shapeStar, shapeNone),colorCustom11,layer = 0, HaLow,offset = -80);
PlotShapes(IIf(Buy, shapeSmallCircle, shapeNone),colorBlue,layer = 0,HaLow,offset = -80);
PlotShapes(IIf(Buy, shapeUpArrow, shapeNone),anim,layer = 0,HaLow,offset = -63);
PlotShapes(IIf(Buy, shapeSquare, shapeNone),colorCustom11,layer = 0,HaLow,offset = -71);
PlotShapes(IIf(Sell, shapeStar, shapeNone),colorYellow,layer = 0, HaHigh,offset = 80);
PlotShapes(IIf(Sell, shapeSmallCircle, shapeNone),colorRed,layer = 0,HaHigh,offset = 80);
PlotShapes(IIf(Sell, shapeDownArrow, shapeNone),anim,layer = 0,HaHigh,offset = -63);
PlotShapes(IIf(Sell, shapeSquare, shapeNone),colorYellow,layer = 0,HaHigh,offset = 71);
AlertIf( Buy, "SOUND C:\\Windows\\Media\\tada.wav", "Audio alert", 2 );
AlertIf( Sell, "SOUND C:\\Windows\\Media\\tada.wav", "Audio alert", 2 );

_SECTION_BEGIN("Price1");
SetChartOptions(0,chartShowArrows|chartShowDates);
_N(Title = StrFormat("{{NAME}} - {{INTERVAL}} {{DATE}} Open %g, Hi %g, Lo %g, Close %g (%.1f%%) {{VALUES}}", O, H, L, C, SelectedValue( ROC( C, 1 ) ) ));
Plot( C, "Close", ParamColor("Color", colorBlack ), styleNoTitle | ParamStyle("Style") | GetPriceStyle() );
_SECTION_END();

_SECTION_BEGIN("Auto Plot HH HL LL");
Q = Param( "% Change", 2, 0.1, 10, 0.1 );
Z = Zig( C , q ) ;
HH = ( ( Z < Ref( Z, -1 ) AND Ref( Z, -1 ) > Ref( Z, -2 ) ) AND (Peak( z, q, 1 ) > Peak( Z, q, 2 ) ) );
LH = ( ( Z < Ref( Z, -1 ) AND Ref( Z, -1 ) > Ref( Z, -2 ) ) AND (Peak( Z, q, 1 ) < Peak( Z, q, 2 ) ) );
HL = ( ( Z > Ref( Z, -1 ) AND Ref( Z, -1 ) < Ref( Z, -2 ) ) AND (Trough( Z, q, 1 ) > Trough( Z, q, 2 ) ) );
LL = ( ( Z > Ref( Z, -1 ) AND Ref( Z, -1 ) < Ref( Z, -2 ) ) AND (Trough( Z, q, 1 ) < Trough( Z, q, 2 ) ) );
GraphXSpace = 5;
dist = 0.5 * ATR( 20 );

for ( i = 0; i < BarCount; i++ )
{
    if ( HH[i] )
        PlotText( "HH", i, H[ i ] + dist[i], colorYellow );

    if ( LH[i] )
        PlotText( "LH", i, H[ i ] + dist[i], colorYellow );

    if ( HL[i] )
        PlotText( "HL", i, L[ i ] - dist[i], colorPink );

    if ( LL[i] )
        PlotText( "LL", i, L[ i ] - dist[i], colorPink );

}
_SECTION_END();

_SECTION_BEGIN("CO8 Trading System");
//Looks for closing prices to be higher then opening prices over last 8 days and buys.  Sells on a 3 stage exit.
//Based on my interpretation of a lecture by Jake Bernstein to ATAA in Melbourne 2009.  Code developed by Zoltan Novak on paid contract.


myShapesDigits = Null;
myShapesDigitsY = Null;
myShapesDigitsColor = colorBlack;

/***************************
*
*	M	A	I	N
*
****************************/
PlotOHLC(O,H,L,C, StrFormat(" " + Date() + "Open %g, Hi %g, Lo %g, Close %g (%.1f%%)\n", O, H, L, C, SelectedValue( ROC( C, 1 ) )) , colorBlack, styleBar);

range = HHV(H-L,10);

Buy = Null;
BuyPrice = Null;
Sell = Null;
SellPrice = Null;

myPositionSize = Null;
myPositionMethod = Null;

//a) create an 8 day moving average of the close price and plot in GREEN
maClose8 = MA(C,Param("ma_period_close" , 8 , 2 , 100, 1)); Plot(maClose8, "maClose8" , colorGreen, styleLine);

//b) create an 8 Day MA of the Open price AND Plot in RED
maOpen8 = MA(O,Param("ma_period_open" , 8 , 2 , 100, 1)); Plot(maOpen8, "maOpen8" , colorRed, styleLine);

trailingStop = Null;

myEntryPrice[1] = Null;
HH[1] = Null;
profit5[1] = Null;
isClosedF[1] = False;
stopLossPrice[1] = Null;
inBuy[1] = False;

myBuyI = Null;

for(i=2;i<BarCount;i++)
{
  myEntryPrice[i] = myEntryPrice[i-1];
  HH[i] = HH[i-1];
  profit5[i] = profit5[i-1];
  isClosedF[i] = isClosedF[i-1];
  stopLossPrice[i] = stopLossPrice[i-1];
  inBuy[i] = inBuy[i-1];

  //C) if A is greater than B then Buy
  if(maOpen8[i-2] > maClose8[i-2] AND maOpen8[i-1] < maClose8[i-1])
  {
    myBuyI = i;

    //D) buy $2100 at open on first bar after cross
    Buy[myBuyI] = True;
    BuyPrice[myBuyI] = O[myBuyI];
    myPositionSize[myBuyI] = 2100 / round(C[myBuyI-1]);
    myPositionMethod[myBuyI] = spsShares;
    myShapesDigits[i] = shapeDigit0;
    myShapesDigitsColor[i] = colorGreen;
    myShapesDigitsY[i] = BuyPrice[myBuyI];

    myEntryPrice[myBuyI] = BuyPrice[myBuyI];
    HH[i] = L[myBuyI];
    profit5[myBuyI] = Null;
    isClosedF[myBuyI] = False;

    //H) initial stop loss is Buy price less the range of the largest bar in past 10 trading days
    //   e.g. if Buy is $10 AND the largest range in past 10 days is 50cents then initial stop loss is $9.50
    stopLossPrice[i] = BuyPrice[myBuyI] - range[i-1];

    inBuy[i] = True;

    //I) stop loss is moved to Buy price after 5 days therefore taking the example
    //   above if the price is $9.80 at Day Close of Day 5 then all stock is sold at the Open on Day 6.
  }

  if(inBuy[i])
  {
    //I) stop loss is moved to Buy price after 5 days therefore taking the example above if
    //the price is $9.80 at Day Close of Day 5 then all stock is sold at the Open on Day 6.
    if( i - myBuyI == Param("1.) Stop Loss To Buy Price on this day" , 6 , 1 , 20 , 1) )
    {
      stopLossPrice[i] = myEntryPrice[myBuyI];
    }

    //stopLoss
    if(L[i] < stopLossPrice[i])
    {
      Sell[i] = True;
      SellPrice[i] = Min(O[i] , stopLossPrice[i]);
      stopLossPrice[i] = Null;
      inBuy[i] = False;
      myShapesDigits[i] = shapeDigit4;
      myShapesDigitsColor[i] = colorBlue;
      myShapesDigitsY[i] = SellPrice[i];
    }

    //e) sell 1/3 of stock at open on day 6 (trading days not calandar days)
    if( i - myBuyI == 6 )
    {
      Buy[i] = sigScaleOut;
      BuyPrice[i] = O[i];
      myPositionSize[i] = 100*1/3;
      myPositionMethod[i] = spsPercentOfPosition;
      myShapesDigits[i] = shapeDigit1;
      myShapesDigitsColor[i] = colorPink;
      myShapesDigitsY[i] = BuyPrice[i];
    }

    //f) Sell the next 1/3 of stock at Open if Open profit at Close on any Day decreases
    //   by 25% from the Open profit on Day 5
    if( Param("2.) Trailing Stop Profit decreasing DAY" , 6 , 1 , 20 , 1) < i - myBuyI AND isClosedF[i] == False)
    {
      //Profit from Day 5.
      profit5[i] = HH[i] - myEntryPrice[myBuyI];

      trailingStop[i] = myEntryPrice[myBuyI] + (1 - Param("2.) Trailing Stop Profit decreasing PRICE PERCENT" , 0.25 , 0.01 , 1.00 , 0.01)) * profit5[i];

      if( L[i] <= trailingStop[i] )
      {
        Buy[i] = sigScaleOut;
        BuyPrice[i] = Min( O[i] , trailingStop[i] );

        //From 2/3 to 1/3 is 50%
        myPositionSize[i] = 100 * Param("2.) Trailing Stop Profit decreasing QUANTITY PERCENT" , 0.5 , 0.01 , 1.00 , 0.01);
        myPositionMethod[i] = spsPercentOfPosition;
        myShapesDigits[i] = shapeDigit2;
        myShapesDigitsColor[i] = colorPink;
        myShapesDigitsY[i] = BuyPrice[i];

        profit5[i] = Null;
        HH[i] = Null;
        myEntryPrice[i] = Null;
        isClosedF[i] = True;
      }
    }

    //g) sell the last 1/3 of stock at open if the B > A
    if(maOpen8[i-2] < maClose8[i-2] AND maOpen8[i-1] > maClose8[i-1])
    {
      Sell[i] = True;
      SellPrice[i] = Open[i];
      myShapesDigits[i] = shapeDigit3;
      myShapesDigitsColor[i] = colorRed;
      myShapesDigitsY[i] = SellPrice[i];

      stopLossPrice[i] = Null;
      isClosedF[i] = True;
    }

    //new Highest since last buy...
    if( inBuy[i] AND HH[i] <= H[i] )
    {
      HH[i] = H[i];
      profit5[i] = HH[i] - myEntryPrice[myBuyI];
    }
  }
}

SetPositionSize( myPositionSize , myPositionMethod );
_SECTION_END();

_SECTION_BEGIN( "fcVS" );
period	= Param( "Period", 13, 1, 240, 1 );
mult	= Param( "Multiplier", 1.7, 1, 240, 0.1 );

f = ATR( period );

VS[0] = Close[0];
trend[0] = 0;
HighC[0] = 0;
Lowc[0] = 0;

for ( i = period + 1; i < BarCount; i++ )
{

    vs[i]		= vs[i-1];
    trend[i]	= trend[i-1];
    highC[i]	= HighC[i-1];
    lowc[i]	= lowc[i-1];

    if ( ( trend[i] >= 0 ) && ( C[i] < VS[i] ) )
    {
        trend[i] = -1;
        HighC[i] = C[i];
        lowc[i] = C[i];
    }

    if ( ( trend[i] <= 0 ) && ( C[i] > VS[i] ) )
    {
        trend[i] = 1;
        HighC[i] = C[i];
        lowc[i] = C[i];
    }

    if ( trend[i] == -1 )
    {
        if ( C[i] < lowc[i] )
            lowc[i] = C[i];

        VS[i] = lowc[i] + ( mult * f[i] );
    }


    if ( trend[i] == 1 )
    {
        if ( C[i] > HighC[i] )
            HighC[i] = C[i];

        VS[i] = HighC[i] - ( mult * f[i] );
    }

}


Buy = Cross( Trend, 0 );
Sell = Cross( 0, Trend );

Plot( Close, "Close", colorBlack, styleCandle );
Plot( VS, "Vol Stop", IIf( trend == 1, 10, 11 ), styleThick );

mkol 	= IIf( Trend == 1, 10,  11 );
Plot( 5, "ribbon", mkol, styleOwnScale | styleArea | styleNoLabel, 0, -5 );	// Weekly trend

shape = Buy * shapeUpArrow + Sell * shapeDownArrow;
PlotShapes( shape, IIf( Buy, colorGreen, colorRed ), 0, IIf( Buy, Low - f, High + f ) );
_SECTION_END();

_SECTION_BEGIN("Stochastic %D");
periods = Param( "Periods", 15, 1, 200, 1 );
Ksmooth = Param( "%K avg", 3, 1, 200, 1 );
Dsmooth = Param( "%D avg", 3, 1, 200, 1 );
Plot( StochD( periods , Ksmooth, DSmooth ), _DEFAULT_NAME(), ParamColor( "Color", colorCycle ), ParamStyle("Style") );
_SECTION_END();

_SECTION_BEGIN("Stochastic %K");
periods = Param( "Periods", 15, 1, 200, 1 );
Ksmooth = Param( "%K avg", 3, 1, 200, 1 );
Plot( StochK( periods , Ksmooth), _DEFAULT_NAME(), ParamColor( "Color", colorCycle ), ParamStyle("Style") );
_SECTION_END();

_SECTION_BEGIN("Average Side Way Mkt");
price = ParamField("field");
n = Param("periods",35);
SA=MA(Price,n);
v1=(StDev(Price,n))^2;

Ca=Null;
Ca[n]=sa[n];

for(i=n+1; i<BarCount;i++){
v2[i]=(CA[i-1]-SA[i])^2;
k[i]=IIf(V2[i]<V1[i],0,1-V1[i]/V2[i]);
CA[i]=CA[i-1]+K[i]*(SA[i-1]-CA[i-1]);
}
Plot(Ca,"OMA("+WriteVal(n,1.0)+")",colorYellow,styleThick);
Col = IIf(BarsSince(Ref(Ca,-1)>Ca)>BarsSince(Ref(Ca,-1)<Ca),colorBrightGreen,colorRed);
Plot(C,"",Col,styleBar);
_SECTION_END();


_SECTION_BEGIN("MIKE");
ChannelPeriods = Param("Channel Periods",10,1,50,1);
AvgPeriods = Param("Average Periods",31,1,50,1);
OverBought = Param("Over Bought Line",64,0,100,1);
OverSold = Param("Over Sold Line",-64,-100,0,1);
ColTCI = ParamColor("TCI Line Color",colorBrown);
ColOB = ParamColor("Over Bought Color",colorRed);
ColOS = ParamColor("Over Sold",colorGreen);
XSpace = Param("GraphXSpace",7,0,20,0.5);

n1 = ChannelPeriods; // Channel periodsdefault is 10.
n2 = AvgPeriods; // Average periodsdefault is 31.

AP = Avg; //Typical Price
ESA = EMA(AP, n1);
D = EMA(abs(AP - ESA), n1);
CI = (AP - ESA) / (0.015 * D);
TCI = EMA(CI, n2);

WaveTrend1 = TCI;
WaveTrend2 = MA(WaveTrend1,4);

myColor =
IIf (WaveTrend1 > WaveTrend2, colorLavender,
IIf (WaveTrend2 > WaveTrend1, colorRed ,colorLightYellow));

Plot(WaveTrend1,"WaveTrend ",myColor,styleDots | styleThick);

//Plot(WaveTrend2,"WaveTrend2",colorLightYellow,styl eDashed);
Plot(WaveTrend2,"WaveTrend2",ParamColor("Signal Line color", colorPaleBlue),styleDots);

Plot(OverBought,"OB Line",ColOB,8+16);//|styleNoLabel);//8+16
Plot(OverSold,"OS Line",ColOS,8+16);//|styleNoLabel);
Plot(n1,"Channel Periods",colorBlue,styleNoLabel |styleNoRescale |styleNoDraw);
Plot(n2,"Avg Periods",colorBlue,styleNoLabel |styleNoRescale | styleNoDraw);
Plot(0,"0",colorRed,styleNoLabel);
//Plot(100,"",9 ,styleOwnScale | styleArea | styleNoLabel,-5,100);
//Background pane coloring

GraphXSpace = XSpace;

_SECTION_END();

_SECTION_BEGIN("Buy Sell Signal");
x = WaveTrend1;
y = WaveTrend2;

Buy=Cross(x,y);
Sell=Cross(y,x);
Buy = ExRem(Buy, Sell);
Sell = ExRem(Sell, Buy);

PlotShapes(shapeUpArrow*Buy,colorGreen);
PlotShapes(shapeDownArrow*Sell,colorRed);
_SECTION_END ();
7 comments
Leave Comment
Please login here to leave a comment.
Back
Can someone throw light on how to get Stochastic Indicator overlaying on the price chart in this AFL? I am using Amibroker 5.60 but I have to delete Stochastic & Wave Trend indicators to get the proper chart here.
Sir Candile Not Display Sir Pls Help Me Plsssssssss…………….
By Elango Tirupru.
@elango6557,
please replace stok code to this
Dear Nalinji,
Your intraday trading system is excellent .
Thanks
Hello,
I am not getting proper candles. can anyone help me on this.
my id is natiraj @ gmail.com
Regards
This nice afl sadly “looks into the future”….
Is the “average periods default” in part “Mike” of this afl 21 or 31 ? In afl “Trendwave” (http://www.wisestocktrader.com/indicators/3384-trendwave-on-amibroker) it is 21 and in afl “Modified Mike” ("http://www.wisestocktrader.com/indicators/3346-modifed-mike) it is 31….Both afl’s are based on "Mike’s Wave Trend.