Stock Portfolio Organizer
The ultimate porfolio management solution.
Shares, Margin, CFD's, Futures and Forex
EOD and Realtime
Dividends and Trust Distributions
And Much More ....
WiseTrader Toolbox
#1 Selling Amibroker Plugin featuring:
Advanced Adaptive Indicators
Advanced Pattern Exploration
Neural Networks
And Much More ....
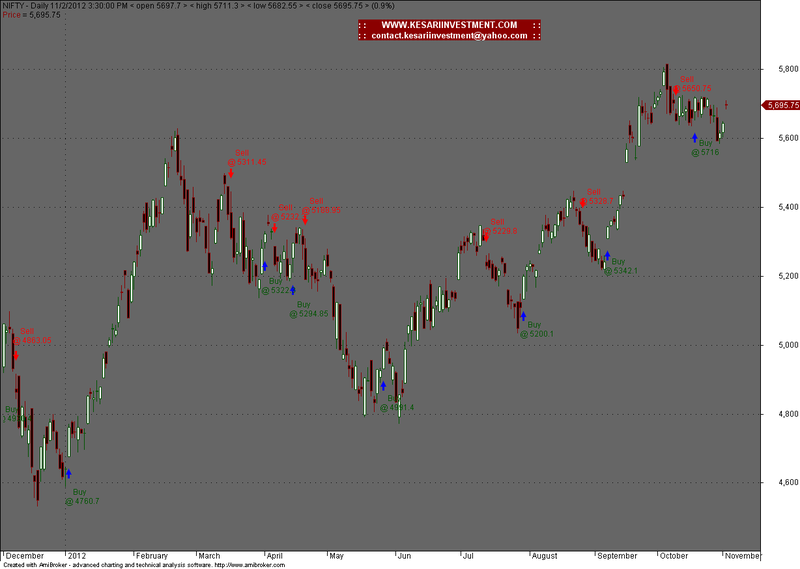
BUY SELL INTRADAY AND DAILY BEST KESARIINVESTMENT for Amibroker (AFL)
Rating:
4 / 5 (Votes 5)
Tags:
trading system, amibroker
DEVELOPING BY ::KESARIINVESTMENT.COM::
We DEVELOPING AMIBROKER AFL plugin DLL SOFTER & LOING SYSTEM FOR SERVER
CONTACT US ::KESARIINVESTMENT.COM::
OR contact@kesariinvestment.com
OR contact.kesariinvestment@yahoo.com
Screenshots
Similar Indicators / Formulas
EMA crossover
Submitted
by Ketan-0 about 13 years ago
Kase Peak Osc. V2 batu
Submitted
by batu1453 almost 10 years ago
Kase CD V2batu
Submitted
by batu1453 almost 10 years ago
Ichimoku
Submitted
by prashantrdx almost 10 years ago
buy and sell two EMAS
Submitted
by mundo0007 about 12 years ago
Adaptive Price Zone (APZ)
Submitted
by AndrewThomas about 13 years ago
Indicator / Formula
Copy & Paste Friendly
/*  ///  DEVELOPING BY      ::KESARIINVESTMENT.COM::

//  We DEVELOPING AMIBROKER AFL plugin DLL SOFTER LOING SYSTEM FOR SERVER

// CONTACT US ::KESARIINVESTMENT.COM:: OR contact@kesariinvestment.com OR
//                                    contact.kesariinvestment@yahoo.com
*/
_SECTION_BEGIN("Stochastic Slow");
if( Status("action") == actionCommentary )
{ printf("(Interpretation is not available yet)");}
uptrend= IIf( StochK(15,3) > StochD(17,3,3), 1, 0 );
downtrend=IIf( StochK(15,3)<StochD(17,3,3), 1, 0 );
crossBuy=Cross(StochK(15,9),StochD(15,3,3));
crossSell=Cross(StochD(15,5,3),StochK(15,3));
kks=StochK( 15 , 3);kkd=StochD( 15 ,3, 3 );kksup=( 50 > kks) AND ( 50 > kkd);kksdw=( 50 < kks) AND ( 50 < kkd);
_SECTION_END();
_SECTION_BEGIN("KESARIINVESTMENT.COM");
SetChartBkGradientFill( ParamColor("BgTop", colorGrey40),ParamColor("BgBottom", colorGrey40));
SetChartOptions(0,chartShowArrows|chartShowDates);
SetChartOptions(0,0,chartGrid20 |chartGrid50 |chartGrid80);
_N(Title = StrFormat("{{NAME}} - {{INTERVAL}} {{DATE}} < open %g > < high %g > < low %g > < close %g > (%.1f%%) {{VALUES}}", O, H, L, C, SelectedValue( ROC( C, 1 ) ) ));

Plot(C,"\nPrice",IIf(C>O,ParamColor("Wick UP Color", colorDarkGreen),IIf(C<=O,ParamColor("Wick Down Color", colorDarkRed),colorLightGrey)),64,0,0,0,0);
Periods = Param("Periods", 11, 1, 300, 1 );
HM=EMA( High , Periods );LM=EMA( Low ,Periods );CM=C;
Buy = Cross(CM,HM) AND kksup ;
Sell = Cross( LM,CM) AND kksdw ;
Buy = ExRem( Buy, Sell );
Sell = ExRem( Sell, Buy );

PlotShapes(IIf(Buy, shapeUpArrow, shapeNone),colorBlue, 0,L, Offset=-27);

PlotShapes(IIf(Sell, shapeDownArrow, shapeNone),colorRed, 0,H, Offset=-27);

GraphXSpace = 15;
dist = 1.1*ATR(54);

for( i = 0; i < BarCount; i++ )
{
if( Buy[i] ) PlotText( "    Buy\n@ " + C[ i ], i, L[ i ]-dist[i], colorDarkGreen );
if( Sell[i] ) PlotText( "    Sell\n@ " + C[ i ], i, H[ i ]+dist[i], colorRed );
}
Filter= Buy OR Sell;
		GfxSelectFont( "Arial", 10, 700, False );
	GfxSetTextAlign(0);
   GfxTextOut( ": :      WWW.KESARIINVESTMENT.COM      : :", 550, 30);
GfxTextOut( ": :  contact.kesariinvestment@yahoo.com  : :", 550, 46);
_SECTION_END();
4 comments
Leave Comment
Please login here to leave a comment.
Back
Simple but seems sweet…
Does this Indicator arrows repaint
bad. waste.
WHAT TIME FRAME FOR CRUDEOIL N BANKNIFTY