Stock Portfolio Organizer
The ultimate porfolio management solution.
Shares, Margin, CFD's, Futures and Forex
EOD and Realtime
Dividends and Trust Distributions
And Much More ....
WiseTrader Toolbox
#1 Selling Amibroker Plugin featuring:
Advanced Adaptive Indicators
Advanced Pattern Exploration
Neural Networks
And Much More ....
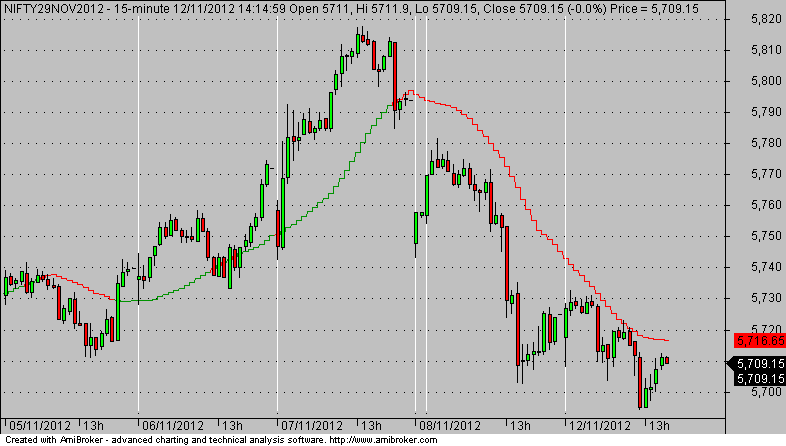
Flip It Indicator for Amibroker (AFL)
Rating:
3 / 5 (Votes 4)
Tags:
amibroker
I have seen Flip It indicator at GCI Financials – CFD Share Trading Demo. The indicator is here in AFL form
Screenshots
Similar Indicators / Formulas
Kavach Of Karna v2
Submitted
by hbkwarez almost 10 years ago
Advanced Elliott Waves
Submitted
by MarcosEn over 12 years ago
3_6Day GuaiLiLv
Submitted
by motorfly over 12 years ago
Williams Alligator System
Submitted
by durgesh1712 over 12 years ago
*Level Breakout system*
Submitted
by Tinych over 12 years ago
Horizontal Live Priceline Tool
Submitted
by northstar over 12 years ago
Indicator / Formula
Copy & Paste Friendly
_SECTION_BEGIN("Price");
SetChartOptions(0,chartShowArrows|chartShowDates);
SetBarsRequired(sbrAll,sbrAll);
SetBarFillColor(IIf(C>O,ParamColor("Candle Up Color", colorBrightGreen),IIf(C<=O,ParamColor("Candle Down Color", colorRed),colorLightGrey)));
Plot(C,"Price",IIf(C>O,ParamColor("Shadow Up Color", colorBlack),IIf(C<=O,ParamColor("Shadow Down Color", colorBlack),colorLightGrey)),64,0,0,0,0);
SetChartBkColor(ParamColor("Panel Color ",colorLightGrey));
SetChartBkGradientFill(ParamColor("Upper Chart",colorLightGrey),ParamColor("Lower Chart",colorLightGrey));

grid_day = IIf(Day()!=Ref(Day(),-1),1,0);
Plot(grid_day,"",colorWhite,styleHistogram|styleDots|styleNoLabel|styleOwnScale);


_N(Title = StrFormat("{{NAME}} - {{INTERVAL}} {{DATE}} Open %g, Hi %g, Lo %g, Close %g (%.1f%%) {{VALUES}}", O, H, L, C, SelectedValue( ROC( C, 1 ) ) ));
Plot( C, "Close", ParamColor("Price Color", colorBlack ), styleNoTitle | ParamStyle("Price Style") | GetPriceStyle() );


_SECTION_END();

t=Param("t", 24, 1, 100, 1);

Top = Sum(High, t) / t;
Bottom = Sum(Low, t) / t;
av=(Top+Bottom)/2;
mc=IIf(av>C, colorRed, colorGreen);
Plot(av, "", mc, styleStaircase);
1 comments
Leave Comment
Please login here to leave a comment.
Back
good job dear friend ….