Stock Portfolio Organizer
The ultimate porfolio management solution.
Shares, Margin, CFD's, Futures and Forex
EOD and Realtime
Dividends and Trust Distributions
And Much More ....
WiseTrader Toolbox
#1 Selling Amibroker Plugin featuring:
Advanced Adaptive Indicators
Advanced Pattern Exploration
Neural Networks
And Much More ....
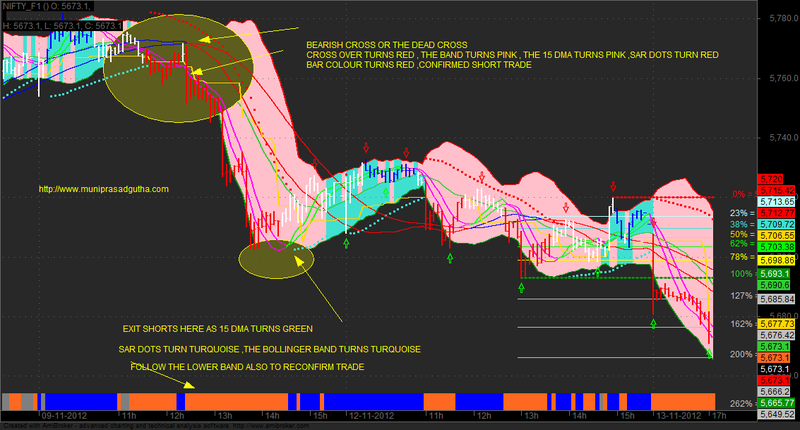
BOLLINGER BAND AND CROSS OVER SYSTEM for Amibroker (AFL)
Rating:
4 / 5 (Votes 7)
Tags:
trading system, amibroker, pivots
Hi friends
Here is the Bollinger band and cross over system.The bb changes colour to pink when bearish and turquoise when bullish.You can reconfirm trade with bar colours and the crosses,sar dots and trend ribbon.The trailing stop is coloured in yellow.Pivot arrows are also provided for being sure on the trade.
For more on this indicator please visit my free blog site
http://www.muniprasadgutha.com
MUNIPRASAD GUTHA
Screenshots
Similar Indicators / Formulas
Trend and Pivot with Support And Resistance Levels
Submitted
by varadan over 11 years ago
Isfandi Trading System II
Submitted
by isfandi about 13 years ago
Buy and Sell as per Buy Arrow and Sell Arrow
Submitted
by nalin Soni over 11 years ago
T3 function cloud
Submitted
by ahmmad almost 13 years ago
Nataraj modified
Submitted
by pully50 over 12 years ago
Indicator / Formula
Copy & Paste Friendly
_SECTION_BEGIN(" Bollinger Bands with cross over and tweaked bar code");
P = ParamField("Price field",-1);
Period = Param("Short Periods", 20, 15, 30, 1 );
Width = Param("Short Width", 2, 1, 10, 1 );

TopCond=BBandTop( P, Period, Width )>Ref(BBandTop( P, Period, Width ),-1);
MidCond=MA(C,Period)>Ref(MA(C,Period),-1);
BotCond=BBandBot( P, Period, Width )>Ref(BBandBot( P, Period, Width ),-1);


UpColor=IIf(TopCond AND MidCond,colorTurquoise,colorPink);
DownColor=IIf(MidCond AND BotCond,colorTurquoise,colorPink);

PlotOHLC(BBandTop( P, Period, Width ),BBandTop( P,Period, Width ),MA(C,Period),MA(C,Period), "", UpColor, styleCloud+styleNoLabel+styleNoTitle, Null, Null, Null, -2 );
PlotOHLC(MA(C,Period),MA(C,Period),BBandBot( P, Period, Width ),BBandBot( P, Period, Width ), "", DownColor, styleCloud+styleNoLabel+styleNoTitle, Null, Null, Null, -2 );

Plot(BBandBot( P, Period, Width ),"",colorGreen,styleThick+styleNoTitle, Null, Null, Null, -1);
Plot(BBandTop( P, Period, Width ),"",colorRed,styleThick+styleNoTitle, Null, Null, Null, -1);
Plot(MA(C,Period),"",colorLime,styleThick+styleNoTitle, Null, Null, Null, -1);

Title=Name();


Filter=TopCond AND MidCond AND BotCond;
AddColumn(V,"volume",1.0);

_SECTION_END();


_SECTION_BEGIN("Price");
SetChartOptions(0,chartShowArrows|chartShowDates);
_N(Title = StrFormat("{{NAME}} - {{INTERVAL}} {{DATE}} Open %g, Hi %g, Lo %g, Close %g (%.1f%%) Vol " +WriteVal( V, 1.0 ) +" {{VALUES}}", O, H, L, C, SelectedValue( ROC( C, 1 )) ));

trendup = IIf(MACD(12,26) > 0 AND MACD(12,26) > Signal(12,26,9), colorBlue, colorWhite);
trendcolor = IIf(MACD(12,26) < 0 AND MACD(12,26) < Signal(12,26,9), colorRed, trendup);
Plot( C, "Close", trendcolor, styleBar | styleThick );

//RSIup = RSI(7) > 70;
//RSIdown = RSI(7) < 30;

sp = Param( "RSI Period", 7, 1, 100 );
r = RSI( sp );
RSIup = r > 70;
RSIdown = r < 30;

shape = RSIup * shapeNone + RSIdown * shapeNone;
PlotShapes(shape, IIf( RSIup, colorBrightGreen, colorRed ), 0, IIf( RSIup, Low, High ) );

if( ParamToggle("Tooltip shows", "All Values | Only Prices" ) )
{
 ToolTip=StrFormat("Open: %g\nHigh:  %g\nLow:   %g\nClose:  %g (%.1f%%)\nVolume: "+NumToStr( V, 1 ), O, H, L, C, SelectedValue( ROC( C, 1 )));
}
_SECTION_END();

SetChartBkColor(ParamColor("Panel color ",colorBlack));

PlotOHLC( Open,  High,  Low,  Close, "", colorLime, styleBar| styleThick   );


_SECTION_BEGIN("trailstops");
EntrySignal = C > ( LLV( L, 20 ) + 2 * ATR( 10 ) );
ExitSignal = C < ( HHV( H, 20 ) - 2 * ATR( 10 ) );
Color = IIf( EntrySignal, colorBlue, IIf( ExitSignal, colorOrange, colorGrey50 ));
TrailStop = HHV( C - 2 * ATR(10), 15 );
ProfitTaker = EMA( H, 13 ) + 2 * ATR(10);

/* plot price chart and stops */
Plot( TrailStop, "Trailing stop", colorGold, styleThick | styleLine  );
Plot( C, "Price", color, styleBar  );

/* plot color ribbon */
Plot( 2, "", Color, styleArea | styleOwnScale | styleNoLabel, -0.1, 50 );


_SECTION_BEGIN("GFX EMA");
procedure Plotlinewidth(pvalue,ptitle,pcolor,pstyle,pmin,pmax,pxshift,plinewidth,pshowdate)
{
local pvalue,ptitle,pcolor,pstyle,pmin,pmax,pxshift,plinewidth,ppenstyle,pshowdate;
local Miny,Maxy; local Lvb,fvb; local pxwidth,pxheight; local TotalBars,axisarea; local i,x,y;
if(plinewidth>0 && Status("action") == 1 && (pstyle & styleLine==styleLine)){
GfxSetOverlayMode(0);
Miny=Status("axisminy"); Maxy=Status("axismaxy");
lvb=Status("lastvisiblebar"); fvb=Status("firstvisiblebar");
pxwidth=Status("pxwidth"); pxheight=Status("pxheight");
TotalBars=Lvb-fvb; xaxisarea=56;
if(pshowdate)yaxisarea=10;
else
yaxisarea=0; i=0;
x=5+i*(pxwidth-xaxisarea-10)/( TotalBars+1);
y=5+yaxisarea+(pvalue[i+fvb]-Miny)*(pxheight-yaxisarea-10)/(Maxy-Miny);
GfxMoveTo(x,pxheight - y);
for(i=1; i<TotalBars AND i<(BarCount-fvb); i++)
{
GfxSelectPen(pcolor[i + fvb],plinewidth,0);
x=5+i*(pxwidth-xaxisarea-10)/(TotalBars+1);
y=5+yaxisarea+(pvalue[i+fvb]-Miny)*(pxheight-yaxisarea-10)/(Maxy-Miny);
GfxLineTo(x,pxheight - y);
}}}
RequestTimedRefresh(2);
_SECTION_END();


_SECTION_BEGIN("Small Triggers");
p1 = Param("TL 1 Periods", 20, 5, 50, 1);
p2 = Param("TL 2 Periods", 5, 3, 25, 1);
TL1 = LinearReg(C, p1);
TL2 = EMA(TL1, p2);
Col1 = IIf(TL1 > TL2, ParamColor("TL Up Colour", colorBrightGreen), ParamColor("TL Dn Colour", colorCustom12));
Plot(TL1, "TriggerLine 1", Col1, styleLine|styleThick|styleNoLabel);
Plot(TL2, "TriggerLine 2", Col1, styleLine|styleThick|styleNoLabel);
_SECTION_END();

_SECTION_BEGIN("Large Triggers");
p3 = Param("TL 3 Periods", 80, 5, 100, 1);
p4 = Param("TL 4 Periods", 20, 3, 100, 1);
TL3 = LinearReg(C, p3);
TL4 = EMA(TL3, p4);
Col1 = IIf(TL3 > TL4, ParamColor("TLL Up Colour", colorBlue), ParamColor("TLL Dn Colour", colorRed));
Plot(TL3, "TriggerLine 3", Col1, styleLine|styleThick|styleNoLabel);
Plot(TL4, "TriggerLine 4", Col1, styleLine|styleThick|styleNoLabel);
_SECTION_END();

_SECTION_BEGIN("Fibo Retrace and Extensions");
	fibs = ParamToggle("Plot Fibs","Off|On",1);
	pctH = Param ("Pivot Hi %", 0.325,0.001,2.0,0.002);
	HiLB = Param ("Hi LookBack",1,1,BarCount-1,1);
	pctL = Param ("Pivot Lo %", 0.325,0.001,2.0,0.002);
	LoLB = Param ("Lo LookBack",1,1,BarCount-1,1);
	Back = Param ("Extend Left = 2",1,1,500,1);
	Fwd  = Param("Plot Forward", 0, 0, 500, 1);
	text = ParamToggle("Plot Text","Off|On",1);
	hts  = Param ("Text Shift", -33.5,-50,50,0.10);
	style =ParamStyle("Line Style",styleLine,styleNoLabel);
x = BarIndex();
pRp  = PeakBars( H, pctH, 1) == 0;
yRp0 = SelectedValue(ValueWhen( pRp, H, HiLB));
xRp0 = SelectedValue(ValueWhen( pRp, x, HiLB));
pSp  = TroughBars( L, pctL, 1) == 0;
ySp0 = SelectedValue(ValueWhen( pSp, L, LoLB));
xSp0 = SelectedValue(ValueWhen( pSp, x, LoLB));
Delta = yRp0 - ySp0;

function fib(ret)
{
retval = (Delta * ret);
Fibval = IIf(ret < 1.0
AND xSp0 < xRp0, yRp0 - retval, IIf(ret < 1.0
AND xSp0 > xRp0, ySp0 + retval,IIf(ret > 1.0
AND xSp0 < xRp0, yRp0 - retval, IIf(ret > 1.0
AND xSp0 > xRp0, ySp0 + retval, Null))));
return FibVal;
}

x0 = Min(xSp0,xRp0)-Back;
x1 = (BarCount -1);

r236 = fib(0.236);	r236I = LastValue (r236,1);
r382 = fib(0.382);	r382I = LastValue (r382,1);
r050 = fib(0.50);		r050I = LastValue (r050,1);
r618 = fib(0.618);	r618I = LastValue (r618,1);
r786 = fib(0.786);	r786I = LastValue (r786,1);
e127 = fib(1.27);		e127I = LastValue (e127,1);
e162 = fib(1.62);		e162I = LastValue (e162,1);
e200 = fib(2.00);		e200I = LastValue (e200,1);
e262 = fib(2.62);		e262I = LastValue (e262,1);
e424 = fib(4.24);		e424I = LastValue (e424,1);

p00 = IIf(xSp0 > xRp0,ySp0,yRp0); 	p00I = LastValue (p00,1);
p100 = IIf(xSp0 < xRp0,ySp0,yRp0); 	p100I = LastValue (p100,1);
color00 =IIf(xSp0 > xRp0,colorLime,colorRed);
color100 =IIf(xSp0 < xRp0,colorLime,colorRed);

numbars = LastValue(Cum(Status("barvisible")));
fraction= IIf(StrRight(Name(),3) == "", 3.2, 3.2);

if(fibs==1)
{
Plot(LineArray(xRp0-Fwd,yRp0,x1,yRp0,Back),"PR",32,8|styleNoRescale,Null, Null,Fwd);
Plot(LineArray(xSp0-Fwd,ySp0,x1,ySp0,Back),"PS",27,8|styleNoRescale,Null, Null,Fwd);
Plot(LineArray(x0-Fwd,r236,x1,r236,Back),"",45,style|styleNoRescale,Null, Null,Fwd);
Plot(LineArray(x0-Fwd,r382,x1,r382,Back),"",44,style|styleNoRescale,Null, Null,Fwd);
Plot(LineArray(x0-Fwd,r050,x1,r050,Back),"",41,style|styleNoRescale,Null, Null,Fwd);
Plot(LineArray(x0-Fwd,r618,x1,r618,Back),"",43,style|styleNoRescale,Null, Null,Fwd);
Plot(LineArray(x0-Fwd,r786,x1,r786,Back),"",42,style|styleNoRescale,Null, Null,Fwd);
Plot(LineArray(x0-Fwd,e127,x1,e127,Back),"e127",47,style|styleNoRescale,Null, Null,Fwd);
Plot(LineArray(x0-Fwd,e162,x1,e162,Back),"e162",47,style|styleNoRescale,Null, Null,Fwd);
Plot(LineArray(x0-Fwd,e200,x1,e200,Back),"p200",47,style|styleNoRescale,Null, Null,Fwd);
Plot(LineArray(x0-Fwd,e262,x1,e262,Back),"p262",47,style|styleNoRescale,Null, Null,Fwd);
Plot(LineArray(x0-Fwd,e424,x1,e424,Back),"p424",25,style|styleNoRescale,Null, Null,Fwd);
}

if(text==1)
{
PlotText(" 0% = " + WriteVal(p00,fraction), 	LastValue(BarIndex())-(numbars/hts), p00I  + 0.05, color00);
PlotText("23% = " + WriteVal(r236,fraction), LastValue(BarIndex())-(numbars/hts), r236I + 0.05, 45);
PlotText("38% = " + WriteVal(r382,fraction), LastValue(BarIndex())-(numbars/hts), r382I + 0.05, 44);
PlotText("50% = " + WriteVal(r050,fraction), LastValue(BarIndex())-(numbars/hts), r050I + 0.05, 41);
PlotText("62% = " + WriteVal(r618,fraction), LastValue(BarIndex())-(numbars/hts), r618I + 0.05, 43);
PlotText("78% = " + WriteVal(r786,fraction), LastValue(BarIndex())-(numbars/hts), r786I + 0.05, 42);
PlotText("100% = " + WriteVal(p100,fraction), LastValue(BarIndex())-(numbars/hts),p100I + 0.05, color100);
PlotText("127% = " + WriteVal(e127,fraction), LastValue(BarIndex())-(numbars/hts),e127I + 0.05, 47);
PlotText("162% = " + WriteVal(e162,fraction), LastValue(BarIndex())-(numbars/hts),e162I + 0.05, 47);
PlotText("200% = " + WriteVal(e200,fraction), LastValue(BarIndex())-(numbars/hts),e200I + 0.05, 47);
PlotText("262% = " + WriteVal(e262,fraction), LastValue(BarIndex())-(numbars/hts),e262I + 0.05, 47);
PlotText("424% = " + WriteVal(e424,fraction), LastValue(BarIndex())-(numbars/hts),e424I + 0.05, 25);
}
_SECTION_END();

  /* **********************************

Code to automatically identify pivots

********************************** */

// -- what will be our lookback range for the hh and ll?
farback=Param("How Far back to go",100,50,5000,10);
nBars = Param("Number of bars", 12, 5, 40);

// -- Title.

Title = Name() + " (" + StrLeft(FullName(), 15) + ") O: " + Open + ",

H: " + High + ", L: " + Low + ", C: " + Close;

// -- Plot basic candle chart

PlotOHLC(Open, High, Low, Close,

"BIdx = " + BarIndex() +

"\n" + "O = " + O + "\n"+"H = "+ H + "\n"+"L = " + L

+ "\n"+"C ",

colorBlack, styleBar);

GraphXSpace=7;

// -- Create 0-initialized arrays the size of barcount

aHPivs = H - H;

aLPivs = L - L;

// -- More for future use, not necessary for basic plotting

aHPivHighs = H - H;

aLPivLows = L - L;

aHPivIdxs = H - H;

aLPivIdxs = L - L;

nHPivs = 0;

nLPivs = 0;

lastHPIdx = 0;

lastLPIdx = 0;

lastHPH = 0;

lastLPL = 0;

curPivBarIdx = 0;

// -- looking back from the current bar, how many bars

// back were the hhv and llv values of the previous

// n bars, etc.?

aHHVBars = HHVBars(H, nBars);

aLLVBars = LLVBars(L, nBars);

aHHV = HHV(H, nBars);

aLLV = LLV(L, nBars);

// -- Would like to set this up so pivots are calculated back from

// last visible bar to make it easy to "go back" and see the pivots

// this code would find. However, the first instance of

// _Trace output will show a value of 0

aVisBars = Status("barvisible");

nLastVisBar = LastValue(Highest(IIf(aVisBars, BarIndex(), 0)));

_TRACE("Last visible bar: " + nLastVisBar);

// -- Initialize value of curTrend

curBar = (BarCount-1);

curTrend = "";

if (aLLVBars[curBar] <

aHHVBars[curBar]) {

curTrend = "D";

}

else {

curTrend = "U";

}

// -- Loop through bars. Search for

// entirely array-based approach

// in future version

for (i=0; i<farback; i++) {

curBar = (BarCount - 1) - i;

// -- Have we identified a pivot? If trend is down...

if (aLLVBars[curBar] < aHHVBars[curBar]) {

// ... and had been up, this is a trend change

if (curTrend == "U") {

curTrend = "D";

// -- Capture pivot information

curPivBarIdx = curBar - aLLVBars[curBar];

aLPivs[curPivBarIdx] = 1;

aLPivLows[nLPivs] = L[curPivBarIdx];

aLPivIdxs[nLPivs] = curPivBarIdx;

nLPivs++;

}

// -- or current trend is up

} else {

if (curTrend == "D") {

curTrend = "U";

curPivBarIdx = curBar - aHHVBars[curBar];

aHPivs[curPivBarIdx] = 1;

aHPivHighs[nHPivs] = H[curPivBarIdx];

aHPivIdxs[nHPivs] = curPivBarIdx;

nHPivs++;

}

// -- If curTrend is up...else...

}

// -- loop through bars

}

// -- Basic attempt to add a pivot this logic may have missed

// -- OK, now I want to look at last two pivots. If the most

// recent low pivot is after the last high, I could

// still have a high pivot that I didn't catch

// -- Start at last bar

curBar = (BarCount-1);

candIdx = 0;

candPrc = 0;

lastLPIdx = aLPivIdxs[0];

lastLPL = aLPivLows[0];

lastHPIdx = aHPivIdxs[0];

lastHPH = aHPivHighs[0];

if (lastLPIdx > lastHPIdx) {

// -- Bar and price info for candidate pivot

candIdx = curBar - aHHVBars[curBar];

candPrc = aHHV[curBar];

if (

lastHPH < candPrc AND

candIdx > lastLPIdx AND

candIdx < curBar) {


// -- OK, we'll add this as a pivot...

aHPivs[candIdx] = 1;

// ...and then rearrange elements in the

// pivot information arrays

for (j=0; j<nHPivs; j++) {

aHPivHighs[nHPivs-j] = aHPivHighs[nHPivs-

(j+1)];

aHPivIdxs[nHPivs-j] = aHPivIdxs[nHPivs-(j+1)];

}

aHPivHighs[0] = candPrc ;

aHPivIdxs[0] = candIdx;

nHPivs++;

}

} else {


// -- Bar and price info for candidate pivot

candIdx = curBar - aLLVBars[curBar];

candPrc = aLLV[curBar];

if (

lastLPL > candPrc AND

candIdx > lastHPIdx AND

candIdx < curBar) {


// -- OK, we'll add this as a pivot...

aLPivs[candIdx] = 1;

// ...and then rearrange elements in the

// pivot information arrays

for (j=0; j<nLPivs; j++) {

aLPivLows[nLPivs-j] = aLPivLows[nLPivs-(j+1)];

aLPivIdxs[nLPivs-j] = aLPivIdxs[nLPivs-(j+1)];

}

aLPivLows[0] = candPrc;

aLPivIdxs[0] = candIdx;

nLPivs++;

}

}

// -- Dump inventory of high pivots for debugging

/*

for (k=0; k<nHPivs; k++) {

_TRACE("High pivot no. " + k

+ " at barindex: " + aHPivIdxs[k] + ", "

+ WriteVal(ValueWhen(BarIndex()==aHPivIdxs[k],

DateTime(), 1), formatDateTime)

+ ", " + aHPivHighs[k]);

}

*/

// -- OK, let's plot the pivots using arrows

PlotShapes(

IIf(aHPivs==1, shapeHollowDownArrow, shapeNone), colorRed, 0,

High, Offset=-15);

PlotShapes(

IIf(aLPivs==1, shapeHollowUpArrow , shapeNone), colorBrightGreen, 0,

Low, Offset=-15);
_SECTION_END();

_SECTION_BEGIN("Dots Color");
acc = Param("Acceleration", 0.01, 0, 1, 0.001 );
accm = Param("Max. acceleration", 0.1, 0, 1, 0.001 );
myColor = IIf (C > SAR( acc, accm ) , colorTurquoise , colorRed);
Plot( SAR( acc, accm ), _DEFAULT_NAME(), myColor , ParamStyle("Style", styleDots |styleThick | styleNoLine, maskDefault | styleDots | styleThick | styleNoLine ) );
_SECTION_END();

SetChartBkGradientFill( ParamColor("BgTop", ColorRGB( 172,172,172 )),

ParamColor("BgBottom", ColorRGB( 172,172,172 )),ParamColor("titleblock",ColorRGB( 172,172,172 )));
8 comments
Leave Comment
Please login here to leave a comment.
Back
nice, good…
thanx
Plot(BBandBot( P, Period, Width ),"",colorGreen,styleThick+styleNoTitle, Null, Null, Null, -1);
Plot(BBandTop( P, Period, Width ),"",colorRed,styleThick+styleNoTitle, Null, Null, Null, -1);
Plot(MA,"",colorLime,styleThick+styleNoTitle, Null, Null, Null, -1);
showing error 16 .. to many arguments
please help
getting error in Plot as mentioned above.Please help as we are using amibroker 5.10.
i want the indicator color bolinger bants for Amibroker dimitris email n.pateras@yahoo.gr
hello sir,
good one,
Satish
Hi,
Can you please give details on buy signal.
I have problem when I try to run analyze to filter stocks like this
Please help me to fix it! thanks a lot
I send the image again cause it seems wrong open link Your text to link here…