Stock Portfolio Organizer
The ultimate porfolio management solution.
Shares, Margin, CFD's, Futures and Forex
EOD and Realtime
Dividends and Trust Distributions
And Much More ....
WiseTrader Toolbox
#1 Selling Amibroker Plugin featuring:
Advanced Adaptive Indicators
Advanced Pattern Exploration
Neural Networks
And Much More ....
Nifty Daily System for Amibroker (AFL)
Rating:
4 / 5 (Votes 9)
Tags:
trading system, amibroker
Hi ,
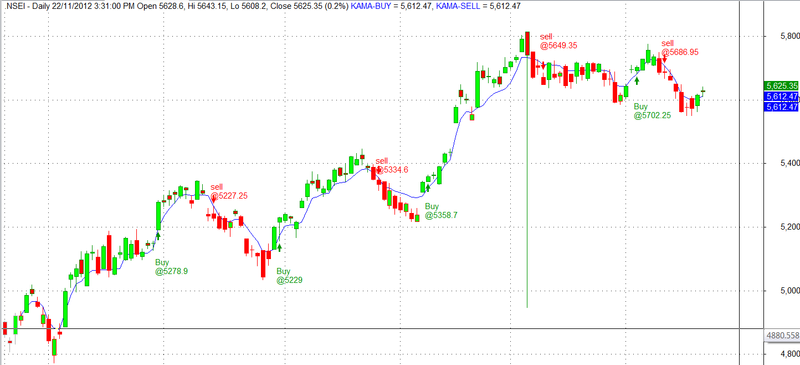
This AFL worked good in daily time frame .
Try to use it and let me know the comment.
Rajeev
Screenshots
Similar Indicators / Formulas
EMA crossover
Submitted
by Ketan-0 about 13 years ago
Kase Peak Osc. V2 batu
Submitted
by batu1453 over 9 years ago
Kase CD V2batu
Submitted
by batu1453 over 9 years ago
Ichimoku
Submitted
by prashantrdx almost 10 years ago
buy and sell two EMAS
Submitted
by mundo0007 about 12 years ago
Adaptive Price Zone (APZ)
Submitted
by AndrewThomas about 13 years ago
Indicator / Formula
Copy & Paste Friendly
// Two adjustable parameter "Buy sensitivity" and "Buy Finetune" provided to adjust entry points.
// Two adjustable parameter "Sell sensitivity" and "Sell Finetune" provided to adjust Exit points.

_SECTION_BEGIN("AMA System");

SetChartOptions(0,chartShowArrows|chartShowDates);
_N(Title = StrFormat("{{NAME}} - {{INTERVAL}} {{DATE}} Open %g, Hi %g, Lo %g, Close %g (%.1f%%) {{VALUES}}", O, H, L, C, SelectedValue( ROC( C, 1 ) ) ));


// Buy adjustments
bs=Param("BUY Sensitivity",3,2,20,1);
bf=Param("BUY Finetune",2,0.1,20,0.1);
// Sell Adjustments
ss=Param("SELL Sensitivity",3,2,20,1);
sf=Param("SELL Finetune",1,0.1,20,0.1);

// common
fast = 2/(2+1);
slow = 2/(30+1);
//BUY part
dirb=abs(Close-Ref(Close,-bs));
volb=Sum(abs(Close-Ref(Close,-1)),bs);
ERb=dirb/volb;
scb =( ERb*(fast-slow)+slow)^2;
xb = AMA( C, scb );
flb=bf*StDev(xb-Ref(xb,-1),20);
j=xb-Ref(xb,-3);


//SELL part
dirs=abs(Close-Ref(Close,-ss));
vols=Sum(abs(Close-Ref(Close,-1)),ss);
ERs=dirs/vols;
scs =( ERs*(fast-slow)+slow)^2;
xs = AMA( C, scs );
fls=sf*StDev(xs-Ref(xs,-1),20);
k=Ref(Xs,-3)-Xs;

Buy=Cross(j,flb);
Sell=Cross(k,fls);
mycolor=IIf(C>xb,colorGreen,colorRed);
Plot( C, "Close", mycolor,styleNoTitle | styleCandle|styleThick   );
Plot(xb,"BUY",colorBlue,1);
Plot(xs,"SELL",colorBlue,1);
Buy = ExRem(Buy,Sell);
Sell = ExRem(Sell,Buy);

shape = Buy * shapeUpArrow +Sell * shapeDownArrow;

PlotShapes( shape, IIf( Buy, colorGreen, colorRed ),0, IIf( Buy, Low, High ));

GraphXSpace = 5;
dist = 1.5*ATR(20);

for( i = 0; i < BarCount; i++ )
{
if( Buy[i] ) PlotText( "Buy\n@" + C[ i ], i, L[ i ]-dist[i], colorGreen );
if( Sell[i] ) PlotText( "sell\n@" + C[ i ], i, L[ i ]+dist[i], colorRed );
}

_SECTION_END();
5 comments
Leave Comment
Please login here to leave a comment.
Back
Hello Rajeev,
Looking good in daily timeframe (Specially scanning)
Thanx you
Seems to be a Great system, thanks rajeev, adjusable parameer will shut the mouth of critics…I like it, coz i can filter the whipsaw by adjusting parameter. Well done brother.
’m greatly impressed with the simplicity and the result of the code. really great work rajeevranjan51.
after so many days some real code is on board.
thanx.
and keep on the good work
outstanding job!! afl stands apart !!
I cant see exact in the chart except price candle.Please help me. buy and sell tag shows empty