Stock Portfolio Organizer
The ultimate porfolio management solution.
Shares, Margin, CFD's, Futures and Forex
EOD and Realtime
Dividends and Trust Distributions
And Much More ....
WiseTrader Toolbox
#1 Selling Amibroker Plugin featuring:
Advanced Adaptive Indicators
Advanced Pattern Exploration
Neural Networks
And Much More ....
swing system v2 for Amibroker (AFL)
Rating:
3 / 5 (Votes 8)
Tags:
amibroker, t3, swing
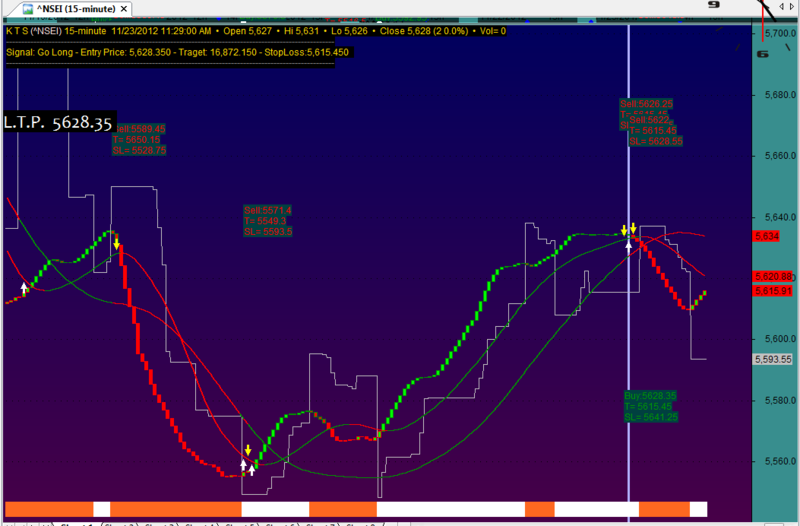
moving average with swing system
Screenshots
Similar Indicators / Formulas
350 Swing Price chart
Submitted
by sahasra about 14 years ago
EOD Trade Explorer
Submitted
by mehere over 15 years ago
Tilson-T3 Oscillator
Submitted
by mrugen over 15 years ago
T3 Panorama Price Chart
Submitted
by mrugen over 15 years ago
Señales de entrada y salida
Submitted
by yayo88 almost 12 years ago
Compare of moving averages (www.amisite.ru)
Submitted
by Andrew777k about 15 years ago
Indicator / Formula
Copy & Paste Friendly
1 2 3 4 5 6 7 8 9 10 11 12 13 14 15 16 17 18 19 20 21 22 23 24 25 26 27 28 29 30 31 32 33 34 35 36 37 38 39 40 41 42 43 44 45 46 47 48 49 50 51 52 53 54 55 56 57 58 59 60 61 62 63 64 65 66 67 68 69 70 71 72 73 74 75 76 77 78 79 80 81 82 83 84 85 86 87 88 89 90 91 92 93 94 95 96 97 98 99 100 101 102 103 104 105 106 107 108 109 110 111 112 113 114 115 116 117 118 119 120 121 122 123 124 125 126 127 128 129 130 131 132 133 134 135 136 137 138 139 140 141 142 143 144 145 146 147 148 149 150 151 152 153 154 155 156 157 158 159 160 161 162 163 164 165 166 167 168 169 170 171 172 173 174 175 176 177 178 179 180 181 182 183 184 185 186 187 188 189 190 191 192 193 194 195 196 197 198 199 200 201 202 203 204 205 206 207 208 209 210 211 212 213 214 215 216 217 218 219 220 221 222 223 224 225 226 227 228 229 230 231 232 233 234 235 236 237 238 239 240 241 242 243 244 245 246 247 248 249 250 251 252 253 254 255 256 257 258 259 260 261 262 263 264 265 266 267 268 269 270 271 272 273 274 275 276 277 278 279 280 281 282 283 284 285 286 287 288 289 290 291 292 293 294 295 | a=20;GraphXSpace=5;p=30;p = Param("p",30,2,100,1);Om=DEMA(O,p);hm=DEMA(H,p);lm=DEMA(L,p);Cm=DEMA(C,p);HACLOSE=(Om+Hm+Lm+Cm)/4;HaOpen = AMA( Ref( HaClose, -1), 1);HaHigh = Max( Hm, Max( HaClose, HaOpen ) );HaLow = Min( Lm, Min( HaClose, HaOpen ) );slope = Param("slope",2,2,100,1);Color20= IIf(LinRegSlope(MA(HaClose,a),slope)<0,colorRed,colorGreen);Plot(MA(HaClose,a),"", color20,styleThick);Color=IIf(Haclose>MA(HaClose,a),colorGreen, colorRed);PlotOHLC( HaOpen, HaOpen, HaClose, HaClose, "" + Name(), Color, styleCandle);_SECTION_END();_SECTION_BEGIN("Priyanvada's Price Action");P = ParamField( "Price field" );CandleT=ParamToggle("Candlestick Display","No|Yes",defaultval=1 ); BarT=ParamToggle("Bar Display","No|Yes",defaultval=0 );LineT=ParamToggle("Line Display","No|Yes",defaultval=0 );//T3MA toggleT3MAT=ParamToggle("Moving Average","No|Yes",defaultval=1 ); //T3MA Check PeriodsT3MAP = Param("T3MA Periods", 46, 2, 300, 1, 10 );function T3(price,periods){s = 0.84;e1=EMA(price,periods);e2=EMA(e1,Periods);e3=EMA(e2,Periods);e4=EMA(e3,Periods);e5=EMA(e4,Periods);e6=EMA(e5,Periods);c1=-s*s*s;c2=3*s*s+3*s*s*s;c3=-6*s*s-3*s-3*s*s*s;c4=1+3*s+s*s*s+3*s*s;Ti3=c1*e6+c2*e5+c3*e4+c4*e3;return ti3;}T3MA = T3(P,T3MAP);for( i = 1; i < BarCount; i++ ) {//assignmentsNvadaOpen[i] = Close[i-1];NvadaClose[i]=Close[i];NvadaHigh[i]=IIf(NvadaOpen[i]>=NvadaClose[i],NvadaOpen[i],NvadaClose[i]);NvadaLow[i]=IIf(NvadaOpen[i]>=NvadaClose[i],NvadaClose[i],NvadaOpen[i]);averagechange[i]=(NvadaOpen[i]+NvadaClose[i])/2;//=============================//CHECKS//check1= uptrend and upbar as referred for last 2 barsCheck1[i]=averagechange[i]>T3MA[i] AND NvadaClose[i]>=NvadaOpen[i-2];//check2= uptrend and downbar as referred for last 2 barsCheck2[i]=averagechange[i]>T3MA[i] AND NvadaClose[i]<NvadaOpen[i-2];//check3= downtrend and downbar as referred for last 2 barsCheck3[i]=averagechange[i]<T3MA[i] AND NvadaClose[i]<=NvadaOpen[i-2];//check4= downtrend and upbar as referred for last 2 barsCheck4[i]=averagechange[i]<T3MA[i] AND NvadaClose[i]>NvadaOpen[i-2];//check5=check2 or check 4 => possible corrections!Check5[i]=Check2[i] OR Check4[i];//Color assignmentif(Check1[i]==1){pricolor[i] =colorGreen;}if(Check3[i]==1){pricolor[i] =colorRed;}if(Check5[i]==1){pricolor[i] =colorYellow;}//Pricolor = IIf(NvadaClose>Ref(NvadaOpen,-2),colorGreen,colorRed);}//T3MA Displayif(T3MAT==1){T3MAcolor = IIf(C>=T3MA,colorGreen,colorRed);Plot(T3MA,"T3MA",T3MAcolor,styleThick);}Buy=T3MAcolor==colorGreen;Sell=T3MAcolor==colorRed;Short=Sell;Cover=Buy;Cover=ExRem(Cover,Short);Short=ExRem(Short,Cover);Buy=ExRem(Buy,Sell);Sell=ExRem(Sell,Buy);PlotShapes(IIf(Buy , shapeUpArrow, shapeNone),colorWhite); PlotShapes(IIf(Sell, shapeDownArrow, shapeNone),colorYellow);no=Param( "Swing", 12, 1, 55 );tsl_col=ParamColor( "Color", colorLightGrey );res=HHV(H,no);sup=LLV(L,no);avd=IIf(C>Ref(res,-1),1,IIf(C<Ref(sup,-1),-1,0));avn=ValueWhen(avd!=0,avd,1);tsl=IIf(avn==1,sup,res);Plot(tsl, _DEFAULT_NAME(), tsl_col, styleStaircase);SetPositionSize(300,spsShares);ApplyStop(0,1,10,1);//-----------end--------------Long=Flip(Buy,Sell); Shrt=Flip(Sell,Buy); BuyPrice=ValueWhen(Buy,C);SellPrice=ValueWhen(Sell,C);Edc=(WriteIf (Buy AND Ref(shrt,-1), " BUY @ "+C+" ","")+ WriteIf (Sell AND Ref(Long,-1), " SEll @ "+C+" ","")+WriteIf(Sell , "Last Trade Profit Rs."+(C-BuyPrice)+"","")+WriteIf(Buy , "Last Trade Profit Rs."+(SellPrice-C)+"",""));_SECTION_END();H1 = SelectedValue( TimeFrameGetPrice( "H", inDaily, -1 ) );L1 = SelectedValue( TimeFrameGetPrice( "L", inDaily, -1 ) );C1 = SelectedValue( TimeFrameGetPrice( "C", inDaily, -1 ) );H2 = SelectedValue( TimeFrameGetPrice( "H", inDaily, 0 ) );L2 = SelectedValue( TimeFrameGetPrice( "L", inDaily, 0 ) );O1 = SelectedValue( TimeFrameGetPrice( "open", inDaily, 0 ) );F4 = 0;D1 = ( H1 - L1 );D2 = ( H2 - L2 );F1 = D1 * 0.433;F2 = D1 * 0.766;F3 = D1 * 1.35;if ( D2 <= F1 ) F4 = F1;else if ( D2 <= F2 ) F4 = F2; else F4 = F3;S_P = ( O1 - F4 );B_P = ( O1 + F4 );BP = ( L2 + F4 );BPTGT = ( BP + ( BP * .0065 ) );//.0015 brokerageBPSTPLS = ( BP - ( BP * .0085 ) );SP = ( H2 - F4 );SPTGT = ( SP - ( SP * .0065 ) );SPSTPLS = ( SP + ( SP * .0085 ) );p = ( H1 + L1 + C1 ) / 3;s1 = ( H1 );r1 = ( L1 );r2 = SelectedValue( L2 );s2 = SelectedValue( H2 );Filter = Buy OR Sell;AddColumn( IIf( Buy, 66, 1 ), "Buy", formatChar, 1, bkcolor = IIf( Buy, 43, 33 ) );AddColumn( IIf( Sell, 83, 1 ), "Sell", formatChar, 1, bkcolor = IIf( Sell, 25, 32 ) );AddColumn( IIf( Short, 83, 1 ), "Short", formatChar, 1, bkcolor = IIf( Short, 25, 32 ) );AddColumn( C, "CMP", 1.2, colorDefault, colorLightBlue );AddColumn( BP, "SELL PRICE", 1.2, colorDefault, colorGreen );AddColumn( BPTGT, "TGT PRICE", 1.2, colorDefault, colorBrown );AddColumn( BPSTPLS, "STPLS BUY", 1.2, colorDefault, colorRed );AddColumn( p, "PIVOT", 1.2, colorDefault, colorYellow );AddColumn( SPSTPLS, "STPLS SELL", 1.2, colorDefault, colorRed );AddColumn( SP, "SELL PRICE", 1.2, colorDefault, colorGreen );AddColumn( SPTGT, "TGT PRICE", 1.2, colorDefault, colorBrown );AddColumn( H1, "PRE-HIGH" );AddColumn( L1, "PRE-LOW" );AddColumn( D1, "PRE-DIFF" );AddColumn( F1, "0.433" );AddColumn( F2, "0.766" );AddColumn( F3, "1.35" );AddColumn( H2, "D-HIGH" );AddColumn( L2, "D-LOW" );AddColumn( D2, "D-DIFF" );AddColumn( F4, "SELECT FACT" );_SECTION_END();//============== TITLE ==============_SECTION_BEGIN("Title");if( Status("action") == actionIndicator ) (Title = EncodeColor(colorGold)+ "K T S" + EncodeColor(colorRose)+" (" + Name() + ") " + EncodeColor(colorGold)+ Interval(2) + " " + Date() +" " +" • Open "+WriteVal(O,1.000)+" • "+"Hi "+WriteVal(H,1.000)+" • "+"Lo "+WriteVal(L,1.000)+" • "+"Close "+WriteVal(C,1.000)+" ("+WriteVal(C-Ref(C,-1),1,0)+" "+WriteVal((C-Ref(C,-1))*100/Ref(C,-1),1.1)+ "%) • Vol= "+ WriteVal(V,1.0) +"\n"+EncodeColor(colorGrey50)+"------------------------------------------------------------------------------------------------------------"+"\n"+EncodeColor(colorGold)+WriteIf (Buy , "Signal: Go Long - Entry Price: "+WriteVal(C)+" - Traget: "+WriteVal((BuyPrice+tsl)+BuyPrice)+" - StopLoss:"+WriteVal(tsl)+" ","")+WriteIf (Sell , "Signal: Go Short - Entry Price: "+WriteVal(C)+" - Target: "+WriteVal((tsl-SellPrice)-SellPrice)+" - StopLoss:"+WriteVal(tsl)+" ","")+EncodeColor(ColorRGB(111,208,255))+WriteIf(Long AND NOT Buy, "Trade: Long - Entry Price: "+WriteVal((BuyPrice))+" - Profit: "+WriteVal((C-BuyPrice))+" "+EncodeColor(colorLime)+"Let your profit runs!","")+WriteIf(shrt AND NOT Sell, "Trade: Short - Entry Price: "+WriteVal((SellPrice))+" - Profit: "+WriteVal((SellPrice-C))+" - "+EncodeColor(colorLime)+"Let your profit runs!","")+"\n"+EncodeColor(colorGrey50)+"------------------------------------------------------------------------------------------------------------");dist = 6*ATR(10);dist1 = 6*ATR(10);for( i = 0; i < BarCount; i++) { if( Buy[i] ) { PlotText( "\Buy:" + C[ i ] + "\nT= " + tsl[i] + "\nSL= " +((C[i]-tsl[i])+C[i]) , i, C[ i ]-dist[i], colorGreen, colorDarkOliveGreen ); } if( Sell[i] ) { PlotText( "Sell:" + C[ i ] + "\nT= " + (C[i]-(tsl[i]-C[i])) + "\nSL= " +tsl[i], i, C[ i ]+dist1[i], colorRed, colorDarkOliveGreen ); }}/*Plot Ribbon */Ribbon1=IIf( (C) >(tsl) ,colorWhite, IIf(( tsl )>( C ), colorOrange,colorYellow));Plot(3, "Ribbon", Ribbon1, styleOwnScale| styleArea| styleNoLabel,-0.5,100);_SECTION_END();_SECTION_BEGIN("Background text");BKswitch = ParamToggle("Background Color","On,Off");OUTcolor = ParamColor("Outer Panel Color",colorTeal);INUPcolor = ParamColor("Inner Panel Upper",colorDarkTeal);INDNcolor = ParamColor("Inner Panel Lower",colorPlum);TitleColor = ParamColor("Title Color ",colorBlack);if (NOT BKswitch){SetChartBkColor(OUTcolor); // color of outer borderSetChartBkGradientFill(INUPcolor,INDNcolor,TitleColor); // color of inner panel}cx = Param( "cxposn", 0, 0, 1250, 1 );cy = Param( "cyposn", 112, 0, 500, 1 );GfxSelectFont( "Candara", 18, 98, False );GfxSetBkColor( colorBlack );GfxSetTextColor( colorWhite );GfxTextOut( "L.T.P. " + C + " ", cx, cy ); |
16 comments
Leave Comment
Please login here to leave a comment.
Back
Hello Jaipal,
Gr8 modification.
Specially Blackground colour, Ribbon added n KpL Stoploss
Then Profit loss and LTP.
THEN BEST EXPLORATION…
Carry on the good work..
Best luck n thnx you
Regards
Anandnst
sir gi when i copy paste the afl on amibroker5.5 it give Error 54.
@bumba819
modify the code
AGAIN ERROR 31 , SIR GI PL CORRECT THE FORMULA, REQUEST
Try this
Delete the error line ….
@anandnst, Hello Sir,
this is a simple buy/sell signal based on T3 function of 46 periods…..!
@jaipal7786,nice preasentation, great efforts, very well done…..!
i were searching and waiting for some good formula regarding T3 function….!
keep this up…..!
can i suggest small change at buy sell signal ?
here we can change to resolve s/l….!
"""T3MAcolor = IIf(C>=Ref(T3MA,-2),colorGreen,colorRed);"""
just see the differance and try anything you know batter….!
@anandnst sir, even give your kind valueable suggestion.
waiting for more good work….!
@bumba819, please remove slash(\) before Buy….!
u have :-
PlotText( “\Buy:”
now just remove \
PlotText( “Buy:” + C[ i ] + "\nT= " + tsl[i] + "\nSL= " ((C[i]-tsl[i])C[i]) , i, C[ i ]-dist[i], colorGreen, colorDarkOliveGreen );
will solve the problem….
thank you all…….
Hello divyesh,
Try Smooth CCI (Crossover system) and Mikano system(Explore it) recently posted by some member in wisestocktrader.
Try to search it & give ur comments
respected Divyesh
as per ur instruction the prob solve
thanks
remove the backslases in the plot statements
@bumba819,
you are allways wellcome….
hi jaipal,
Good work, thanx,
but Buy side plot statements(Buy Target & Stoplosses) wrong, change that ok
*STOPLOSS & TARGETS ARE NOT UPTO MARK NEEDS SOME TUNING TO BE DONE HOPE THAT IF RECTIFIED CAN BECOME A MONEY DELIVERING ATM MACHINE “jaipal7786” GOOD WORK DONE GOOD LUCK FOR NEW UPDATES IF LAUNCHING *
super one indicator i ever seen till today
thanks to the creator and thaks to wisestoktraders.com
keep it up
ITS ONLY SHOW SELLING SL TRG NOT BUY SHOW
super one indicator i ever seen till today
thanks to the creator and thaks to wisestoktraders.com
keep it up