Stock Portfolio Organizer
The ultimate porfolio management solution.
Shares, Margin, CFD's, Futures and Forex
EOD and Realtime
Dividends and Trust Distributions
And Much More ....
WiseTrader Toolbox
#1 Selling Amibroker Plugin featuring:
Advanced Adaptive Indicators
Advanced Pattern Exploration
Neural Networks
And Much More ....
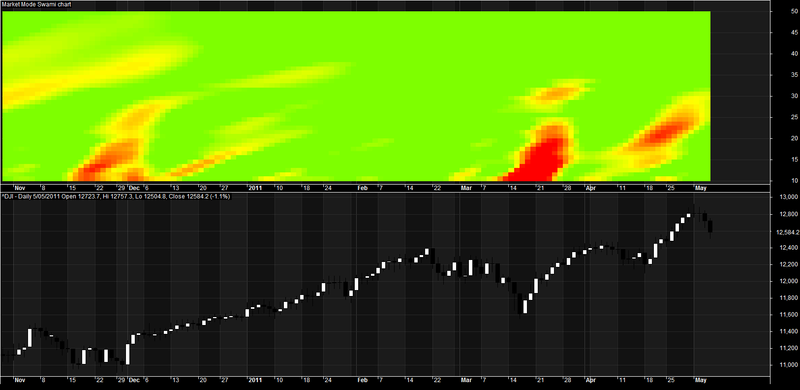
Market Mode Indicator for Amibroker (AFL)
Rating:
5 / 5 (Votes 1)
Tags:
amibroker
In “Setting Strategies With SwamiCharts” in this issue, authors John Ehlers & Ric Way present new examples of their SwamiCharts, which were introduced in last month’s S&C article, “Introducing SwamiCharts.”
I am sure this will help for every trader. Attach this indicator below your chart. Trader as per your buy sell rules & off course have look at this indicator for high probability traders
Viswanath
Screenshots
Similar Indicators / Formulas
Kavach Of Karna v2
Submitted
by hbkwarez almost 10 years ago
Advanced Elliott Waves
Submitted
by MarcosEn over 12 years ago
3_6Day GuaiLiLv
Submitted
by motorfly over 12 years ago
Williams Alligator System
Submitted
by durgesh1712 over 12 years ago
*Level Breakout system*
Submitted
by Tinych over 12 years ago
Horizontal Live Priceline Tool
Submitted
by northstar over 12 years ago
Indicator / Formula
Copy & Paste Friendly
http://www.traders.com/Documentation/FEEDbk_docs/2012/04/TradersTips.html#item4
6 comments
Leave Comment
Please login here to leave a comment.
Back
Absolutely useless!!
This is not for “quant” minds, but those in the “art”.
This is the best indicator. I have tested & using for many years
can anyone please explain how to use this. @admin sir can you please help??
thanks in advance
@chetan Try googling ‘Swami Charts’ there are some good resources there to explain what they are.
@admin
thanks sir …that was really helpful.