Stock Portfolio Organizer
The ultimate porfolio management solution.
Shares, Margin, CFD's, Futures and Forex
EOD and Realtime
Dividends and Trust Distributions
And Much More ....
WiseTrader Toolbox
#1 Selling Amibroker Plugin featuring:
Advanced Adaptive Indicators
Advanced Pattern Exploration
Neural Networks
And Much More ....
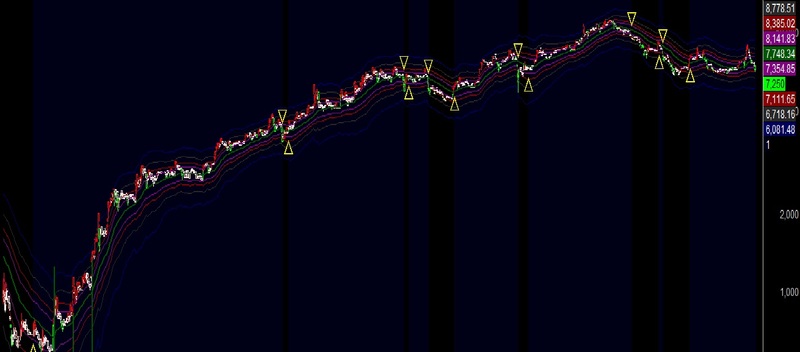
Yancedolly Bands V.2 for Amibroker (AFL)
Rating:
4 / 5 (Votes 3)
Tags:
amibroker, bands
Have a nice day.
Screenshots
Similar Indicators / Formulas
Bollinger - Keltner Bands
Submitted
by kaiji over 14 years ago
Trend Bands
Submitted
by rogercraft about 14 years ago
Jurik's Spandex Band
Submitted
by xavier over 12 years ago
Bollinger %B
Submitted
by konidena about 14 years ago
Bollinger Band Squeeze & Expansion
Submitted
by razasia about 14 years ago
Indicator / Formula
Copy & Paste Friendly
_SECTION_BEGIN("Background Color");
BKswitch = ParamToggle("Background Color","On,Off");

OUTcolor =colorBlack;// ParamColor("Outer Panel Color",colorBlack);
INUPcolor =colorBlack;// ParamColor("Inner Panel Upper",colorBlack);
INDNcolor =colorBlack;// ParamColor("Inner Panel Lower",colorBlack);
TitleColor =colorBlack;// ParamColor("Title Color ",colorBlack);

if (NOT BKswitch)
{
SetChartBkColor(OUTcolor); // color of outer border
SetChartBkGradientFill(INUPcolor,INDNcolor,TitleColor); // color of inner panel
}
_SECTION_END();

_SECTION_BEGIN("Parameter Color");
Line1=17;//ParamColor("Line Yancedolly Bands Medium Cycle Color",17);
Line2=6;//ParamColor("Line Yancedolly Bands Short Cycle Color",6);
Line3=9;//ParamColor("Line Floor Top Color",9);
Peak_valley_color=ColorRGB(0,0,23);//ParamColor("Peak_valley_color",colorPaleBlue);
Vol1=colorDarkGreen;//ParamColor("Vol Up Color",colorDarkGreen);
Vol2=colorDarkRed;//ParamColor("Vol Down Color",colorDarkRed);
Vol3=colorDarkGrey;//ParamColor("Vol Avarage Color",23);
price1=colorRose;//ParamColor("Price Color",colorRose);
price2=colorBrightGreen;//ParamColor("Price Down Color",colorBrightGreen);
price3=colorRed;//ParamColor("Price Up Color",colorRed);
_SECTION_END();

_SECTION_BEGIN("Volume");

C1 = Ref(C, -1);
uc = C > C1; dc = C <= C1;
ud = C > O; dd = C <= O;

green = 1; blue = 2; yellow = 3; red = 4; white = 5;
VType = IIf(ud,
            IIf(uc, green, yellow),
         IIf(dd,
            IIf(dc, red, blue), white));

/* green volume: up-day and up-close*/
gv = IIf(VType == green, V, 0);
/* yellow volume: up-day but down-close */
yv = IIf(VType == yellow, V, 0);
/* red volume: down-day and down-close */
rv = IIf(VType == red, V, 0);
/* blue volume: down-day but up-close */
bv = IIf(VType == blue, V, 0);
if (NOT ParamToggle("Volume Switch","On,Off"))
{
Plot( Volume, _DEFAULT_NAME(), IIf( VType==green OR VType==blue, Vol1, Vol2), styleNoTitle | ParamStyle( "Style", styleHistogram | styleOwnScale | styleThick | styleNoLabel, maskHistogram  ), 2 );
Plot(MA(Volume,5/*Param("MA Periods",5,5,50,1)*/),"",Vol3,styleLine |styleOwnScale ,5/*Param("Scale",5,1,20,1)*/);
}
_SECTION_END();


_SECTION_BEGIN("Yancedolly Bands");

hcl=(O+H+L+C)/4;
Ho=AMA(Ref(hcl,-1),0.5);
HH=Max(H,Max(hcl,Ho));
HL=Min(L,Min(hcl,Ho));

trader = (hcl);
VarRedLine = WMA(trader,5);
VarBlueLine = MA(trader,8);
Per =15;// Param("MA Periods",15,3,50,1);
thick=0.5;//Param("thickness",0.5,0.01,5,0.01);
HDCPeriods = per;

bbbot = BBandBot( trader, HDCPeriods, 2 );
bbc=MA(trader,HDCPeriods);
bbtop = BBandTop( trader, HDCPeriods, 2 );


K1=5;// Param("EMA Periods?",5,3,50);
K2=10;// Param("ATR Periods?",10,2,50);
Mul=1;//Param("ATR Multiplier?",1,0.5,5,0.5);
Mi=EMA(C, K1);
Kel= ATR(K2)*Mul;
UB= Mi + Kel;
LB= Mi - Kel;

CY2 =80/2;//  Param("Medium Cycle Length?" ,80, 1 ,1000 ,1 )/2;
M2 = 1;// Param("Medium Cycle Multiplyer?" ,3, 0.01 ,10 ,1 );
UpY=EMA(C, CY2)+M2*ATR(CY2);
MdY=EMA(C, CY2);
DnY=EMA(C, CY2)-M2*ATR(CY2);


UpperBand4 =EMA( C, CY2) + ( 6.8540 * ATR(CY2));
UpperBand3 =EMA( C, CY2) + ( 4.2360 * ATR(CY2));
UpperBand2=EMA( C, CY2) +  ( 2.6180 * ATR(CY2));
UpperBand1=EMA( C, CY2) +  ( 1.6180 * ATR(CY2));

MidPoint=EMA(C, CY2);

LowerBand1=EMA( C, CY2) - ( 1.6180 * ATR(CY2));
LowerBand2=EMA( C, CY2) - ( 2.6180 * ATR(CY2));
LowerBand3=EMA( C, CY2) - ( 4.2360 * ATR(CY2));
LowerBand4=EMA( C, CY2) - ( 6.8540 * ATR(CY2));


if (NOT ParamToggle("Yancedolly Bands Info","On,Off"))
{


Plot(UpperBand2,"UpperBand2",colorDarkRed,1);
Plot(UpperBand1,"UpperBand1",colorViolet,1);
Plot(MidPoint,"MidPoint",colorDarkGreen,4);
Plot(LowerBand1,"LowerBand1",colorViolet,1);
Plot(LowerBand2,"LowerBand2",colorDarkRed,1);

if (NOT ParamToggle("Band3","On,Off"))
{
Plot(UpperBand3,"UpperBand3",colorDarkGrey,1);
Plot(LowerBand3,"LowerBand3",colorDarkGrey,1);
}
if (NOT ParamToggle("Band4","On,Off"))
{
Plot(UpperBand4,"UpperBand4",colorDarkTeal,1);
Plot(LowerBand4,"LowerBand4",colorDarkTeal,1);
}
//Plot (UB,"UB",Line2,1);
//Plot (LB,"LB",Line2,1);
}else
{


Plot(UpperBand2,"",colorDarkRed,1);
Plot(UpperBand1,"",colorViolet,1);
Plot(MidPoint,"",colorDarkGreen,4);
Plot(LowerBand1,"",colorViolet,1);
Plot(LowerBand2,"",colorDarkRed,1);

if (NOT ParamToggle("Band3","On,Off"))
{
Plot(UpperBand3,"",colorDarkGrey,1);
Plot(LowerBand3,"",colorDarkGrey,1);
}
if (NOT ParamToggle("Band4","On,Off"))
{
Plot(UpperBand4,"",colorDarkTeal,1);
Plot(LowerBand4,"",colorDarkTeal,1);
}
//Plot (UB,"",Line2,1);
//Plot (LB,"",Line2,1);
}


_SECTION_END();


_SECTION_BEGIN( "Price" );
GraphXSpace = 5;
SetChartOptions( 0, chartShowDates | chartShowArrows | chartLogarithmic | chartWrapTitle );
_N( Title = StrFormat( "{{NAME}} - " + SectorID( 1 ) + " - {{INTERVAL}} {{DATE}} Open %g, Hi %g, Lo %g, Close %g (%.1f%%) Vol " + WriteVal( V, 1.0 ) + " {{VALUES}}", O, H, L, C, SelectedValue( ROC( C, 1 ) ) ) );
Plot( C, "Close", IIf(L<=LB,price2,IIf(H>=UB,price3,price1)), styleCandle | styleNoTitle | ParamStyle( "Style" ) | GetPriceStyle() );

if ( ParamToggle( "Tooltip shows", "All Values|Only Prices" ) )
{
    ToolTip = StrFormat( "Open: %g\nHigh:  %g\nLow:   %g\nClose:  %g (%.1f%%)\nVolume: " + NumToStr( V, 1 ), O, H, L, C, SelectedValue( ROC( C, 1 ) ) );
}
_SECTION_END();


_SECTION_BEGIN("Buy_Sell_Yancedolly_Bands");


Buy_LowerBand2 =C>LowerBand2 AND Ref(LowerBand2,-3)<LowerBand2;
Sell_LowerBand2 =C<LowerBand2;


Buy_LowerBand2 =ExRem(Buy_LowerBand2,Sell_LowerBand2); Sell_LowerBand2=ExRem(Sell_LowerBand2,Buy_LowerBand2);

Buy=Buy_LowerBand2 ;
Sell=Sell_LowerBand2;
PlotShapes( Buy_LowerBand2* shapeHollowUpTriangle, colorYellow,0, L, -18);
PlotShapes( Sell_LowerBand2 * shapeHollowDownTriangle, colorYellow,0, H, -18);


if (NOT ParamToggle("Buy_Dolly_bands","On,Off"))
{

PlotShapes( Buy_LowerBand2* shapeHollowUpTriangle, colorYellow,0, L, -18);
PlotShapes( Sell_LowerBand2 * shapeHollowDownTriangle, colorYellow,0, H, -18);
Plot( Flip( Buy_LowerBand2, Sell_LowerBand2 ), "", Peak_valley_color, styleArea | styleOwnScale, 0, 1 );

}

_SECTION_END();
0 comments
Leave Comment
Please login here to leave a comment.
Back