Stock Portfolio Organizer
The ultimate porfolio management solution.
Shares, Margin, CFD's, Futures and Forex
EOD and Realtime
Dividends and Trust Distributions
And Much More ....
WiseTrader Toolbox
#1 Selling Amibroker Plugin featuring:
Advanced Adaptive Indicators
Advanced Pattern Exploration
Neural Networks
And Much More ....
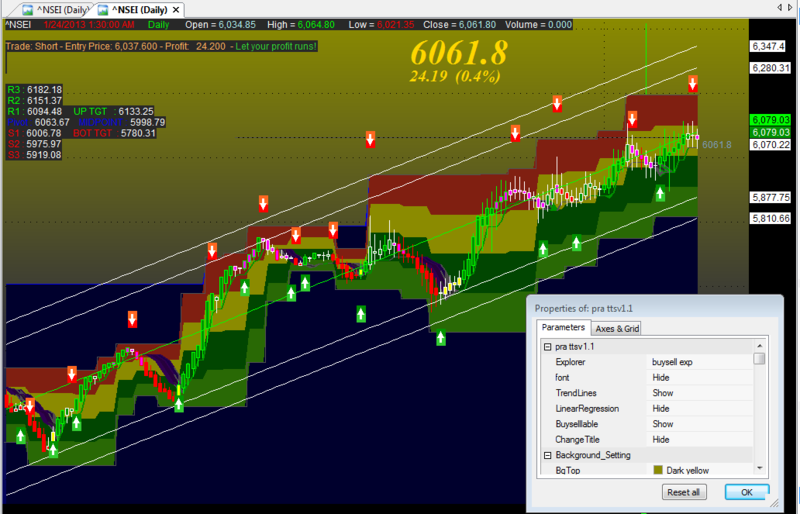
PRA TTS v1.1 for Amibroker (AFL)
Rating:
2 / 5 (Votes 3)
Tags:
trading system, amibroker, exploration, pivots
technical added—-
1-tow type exploration(mrkt exp or buy/sell switch in prameter),(switchable)
2-trend line added,(switchable),
3-regreshion trend,(switchable),
4-buy/sell label,(switchable)/
5-accurate buy/sell signal,
6-magnified price two type(switchable)
7-pivot already…..
enjoy trading..
Screenshots
Similar Indicators / Formulas
PIVOT POINT WITH VPA1 FOR AMIBROKER
Submitted
by METHUN over 13 years ago
Khichadi_R50_R3212.afl
Submitted
by kartmer555 over 13 years ago
HOLY GRAIL
Submitted
by prasadbrao almost 12 years ago
PRA TTS
Submitted
by jaipal7786 about 11 years ago
Market Profile with Volume and Camarilla Pivots
Submitted
by bower about 14 years ago
KNP analysis 1
Submitted
by kushal over 12 years ago
Indicator / Formula
Copy & Paste Friendly
Explorer= ParamToggle("Explorer","buysell exp|market exp",1);
font = ParamToggle("font","Show|Hide",1);
TrendLines= ParamToggle("TrendLines","Show|Hide",0);
LinearRegression= ParamToggle("LinearRegression","Show|Hide",0);
Buyselllable= ParamToggle("Buyselllable","Show|Hide",0);
ChangeTitle= ParamToggle("ChangeTitle","Show|Hide",1);
_SECTION_BEGIN("Background_Setting");
SetChartBkGradientFill( ParamColor("BgTop", colorDarkYellow),
ParamColor("BgBottom", colorDarkTeal),ParamColor("titleblock",colorDarkGrey ));
SetChartBkColor(colorTeal); // color of outer border
_SECTION_END();

SetChartOptions(0,chartShowArrows | chartShowDates);
if(TrendLines==1)
{
_SECTION_BEGIN("Trend Lines");
p1 = Param("TL 1 Periods", 20, 5, 50, 1);
p2 = Param("TL 2 Periods", 5, 3, 25, 1);
TL1 = LinearReg(C, p1);
TL2 = EMA(TL1, p2);
Col1 = IIf(TL1 > TL2, ParamColor("TL Up Colour", colorGreen), ParamColor("TL Dn Colour", colorRed));
Plot(TL1, "TriggerLine 1", Col1, styleLine|styleThick|styleNoLabel);
Plot(TL2, "TriggerLine 2", Col1, styleLine|styleThick|styleNoLabel);
_SECTION_END();
}
//================================================End Chart Configuration===============================================================================

if(font==0)
{
_SECTION_BEGIN("Name");
GfxSetOverlayMode(0);
GfxSelectFont("Tahoma", Status("pxheight")/8 );
GfxSetTextAlign( 6 );// center alignment
GfxSetTextColor( ColorHSB( 42, 42, 42 ) );
GfxSetBkMode(0); // transparent
GfxTextOut( Name(), Status("pxwidth")/2, Status("pxheight")/12 );
GfxSelectFont("Tahoma", Status("pxheight")/18 );
GfxTextOut("" , Status("pxwidth")/2, Status("pxheight")/4 );
GfxSelectFont("Tahoma", Status("pxheight")/18 );
GfxSelectFont("Tahoma", Status("pxheight")/36 );
GfxTextOut( "", Status("pxwidth")/2, Status("pxheight")/3 );
_SECTION_END();

//Magfied Market Price
FS=Param("Font Size",72,11,100,1);
GfxSelectFont("Times New Roman", FS, 700, True );
GfxSetBkMode(0); // transparent
GfxSetTextColor( ColorHSB( 42, 42, 42 ) );
Hor=Param("Horizonta Position",615,1,1200,1);
Ver=Param("Vertica Position",152,1,830,1);
GfxTextOut(""+C, Hor , Ver );
YC=TimeFrameGetPrice("C",inDaily,-1);
DD=Prec(C-YC,2);
xx=Prec((DD/YC)*100,2);
FS2=Param("Font Size2",35,11,100,1);
GfxSelectFont("Times New Roman", FS2,11, 700, True );
GfxSetBkMode( colorBlack );
Hor1=Param("Horizontal Position",615,1,1200,1);
Ver1=Param("Vertical Position",188,1,830,1);
GfxSetTextColor( ColorHSB( 42, 42, 42 ) );
GfxTextOut(""+DD+"  ("+xx+"%)", Hor1 , Ver1+45 );
}
else
{{
//Magfied Market Price
fse=Param("Font Sizee",35,11,100,1);
GfxSelectFont("Times New Roman", fse, 700, True );
GfxSetBkMode( colorGold );
GfxSetTextColor( ParamColor("Color",colorGold) );
Hora=Param("Horizontal Positiona",525,1,1200,1);
Vera=Param("Vertical Positiona",17,1,830,1);
GfxTextOut(""+C, Hora , Vera );
YCa=TimeFrameGetPrice("C",inDaily,-1);
DDa=Prec(C-YCa,2);
xxa=Prec((DDa/YCa)*100,2);
FSb=Param("Font Sizeb",16,11,100,1);
GfxSelectFont("Times New Roman",fsb, 700, True );
GfxSetBkMode( colorBlack );
GfxSetTextColor(ParamColor("Color",colorYellow) );
GfxTextOut(""+DDa+"  ("+xxa+"%)", Hora , Vera+45 );
 _SECTION_END();
}}
//====================================Start of Linear Regression Code==================================================================================
if(LinearRegression==1)
{
P = ParamField("Price field",-1);

Length = 150;

Daysback = Param("Period for Liner Regression Line",Length,1,240,1);
shift = Param("Look back period",0,0,240,1);

//=============================== Math Formula ========================================================================================================

x = Cum(1);
lastx = LastValue( x ) - shift;
aa = LastValue( Ref(LinRegIntercept( p, Daysback), -shift) );
bb = LastValue( Ref(LinRegSlope( p, Daysback ), -shift) );
y = Aa + bb * ( x - (Lastx - DaysBack +1 ) );

//==================Plot the Linear Regression Line ====================================================================================================

LRColor = ParamColor("LR Color", colorCycle );
LRStyle = ParamStyle("LR Style");

LRLine =  IIf( x > (lastx - Daysback) AND BarIndex() < Lastx, y, Null );

LRStyle = ParamStyle("LR Style");
Angle = Param("Angle", 0.05, 0, 1.5, 0.01);// A slope higher than 0.05 radians will turn green, less than -0.05 will turn red and anything in between will be white.

LRLine = IIf( x > (lastx - Daysback) AND BarIndex() < Lastx, y, Null );

Pi = 3.14159265 * atan(1); // Pi
SlopeAngle = atan(bb)*(180/Pi);

LineUp = SlopeAngle > Angle;
LineDn = SlopeAngle < - Angle;

if(LineUp)
{
Plot(LRLine, "Lin. Reg. Line Up", IIf(LineUp, colorBrightGreen, colorWhite), LRStyle);
}
else
{
Plot(LRLine, "Lin. Reg. Line Down", IIf(LineDn, colorDarkRed, colorWhite), LRStyle);
}

//==========================  Plot 1st SD Channel ======================================================================================================

SDP = Param("Standard Deviation", 1.5, 0, 6, 0.1);
SD = SDP/2;

width = LastValue( Ref(SD*StDev(p, Daysback),-shift) ); //Set width of inside chanels here.
SDU = IIf( x > (lastx - Daysback) AND BarIndex() < Lastx, y+width , Null ) ;
SDL = IIf( x > (lastx - Daysback) AND BarIndex() < Lastx, y-width , Null ) ;

SDColor = ParamColor("SD Color", colorCycle );
SDStyle = ParamStyle("SD Style");

Plot( SDU , "Upper Lin Reg", colorWhite,SDStyle ); //Inside Regression Lines
Plot( SDL , "Lower Lin Reg", colorWhite,SDStyle ); //Inside Regression Lines

//==========================  Plot 2d SD Channel ========================================================================================================

SDP2 = Param("2d Standard Deviation", 2.0, 0, 6, 0.1);
SD2 = SDP2/2;

width2 = LastValue( Ref(SD2*StDev(p, Daysback),-shift) ); //Set width of outside chanels here.
SDU2 = IIf( x > (lastx - Daysback) AND BarIndex() < Lastx, y+width2 , Null ) ;
SDL2 = IIf( x > (lastx - Daysback) AND BarIndex() < Lastx, y-width2 , Null ) ;

SDColor2 = ParamColor("2 SD Color", colorCycle );
SDStyle2 = ParamStyle("2 SD Style");

Plot( SDU2 , "Upper Lin Reg", colorWhite,SDStyle2 ); //OutSide Regression Lines
Plot( SDL2 , "Lower Lin Reg", colorWhite,SDStyle2 ); //OutSide Regression Lines

Trend = IIf(LRLine > Ref(LRLine,-1),colorGreen,colorRed);//Changes LR line to green if sloping up and red if sloping down.

Plot( LRLine , "LinReg", Trend, LRSTYLE );

//============================ End Indicator Code =========
}

_SECTION_BEGIN("Flower");
Show_color = ParamToggle("Display CandleColor", "No|Yes", 1);
r1 = Param( "ColorFast avg", 5, 2, 200, 1 );
r2 = Param( "ColorSlow avg", 10, 2, 200, 1 );
r3 = Param( "ColorSignal avg", 5, 2, 200, 1 );

Prd1=Param("ATR Period",4,1,20,1);
Prd2=Param("Look Back",7,1,20,1);
green = HHV(LLV(L,Prd1)+ATR(Prd1),Prd2);
red = LLV(HHV(H,Prd1)-ATR(Prd1),Prd2);
flowerClose = EMA((Open+High+Low+Close)/4,3) ;
flowerOpen = EMA((Ref(Open,-1) + Ref(flowerClose,-1))/2,3);
Temp = Max(High, flowerOpen);
flowerHigh = EMA(Max(Temp, flowerClose),3);
Temp = Min(Low,flowerOpen);
flowerLow = EMA(Min(Temp, flowerClose),3);


m1=MACD(r1,r2);
s1=Signal(r1,r2,r3);
mycolor=IIf(m1<0 AND m1>s1, colorYellow,IIf(m1>0 AND m1>s1,colorGreen,IIf(m1>0 AND m1<s1,colorCustom12,colorRed)));
if(Show_color)
{
ColorHighliter = myColor;
SetBarFillColor( ColorHighliter );


}

barColor=IIf(C>Green ,colorBrightGreen,IIf(C < RED,colorRed,colorWhite));


PlotOHLC( IIf(flowerOpen<flowerClose, flowerOpen, flowerClose),flowerHigh,flowerLow,IIf(flowerOpen<flowerClose, flowerClose, flowerOpen), "Close", barColor, styleNoTitle | styleCandle);


_SECTION_END();


//**********************************************************************************
//        Plot price horizontal line                                               *
//**********************************************************************************/
_SECTION_BEGIN("Price Line");

PriceLineColor=ParamColor("PriceLineColor",ColorRGB(82,82,82));
PriceLevel = ParamField("PriceField", field = 3 );

Daysback    = Param("Bars Back",100,10,500,1);
FirstBar    = BarCount - DaysBack;
YY          = IIf(BarIndex() >= Firstbar,EndValue(PriceLevel),Null);

Plot(YY,"Current Price",PriceLineColor,ParamStyle("LineStyle",styleLine|styleDashed|styleNoTitle|styleNoLabel|styleThick,maskAll));


side = Param("side",1,0,1000,1);

dist = 0;

for( i = 0; i < BarCount; i++ )
{
 if(i+side== BarCount) PlotText( "\n    " + PriceLevel[ i ], i, YY[ i ]-dist[i], colorLightBlue );
}


_SECTION_END();


_SECTION_BEGIN("Color_Me_Bad");
a =5; //Param("Average Pds", 5, 1, 10, 1 );
n =8; //Param("Short Pds", 8, 5, 21, 1 );
m =60; //Param("Long Pds", 60, 0, 90, 1 );

Var4 =(Low+High+2*Close)/4;
OP = EMA(Var4,a);
res1 = HHV(OP,n);

res2 =HHV(OP,m);
sup2 =LLV(OP,m);
sup1 =LLV(OP,n);


Linecolor1 = IIf(Op==sup1,ColorRGB(48,0,81),IIf(Op==res1,colorGreen,ColorRGB(80,80,80)));
Linecolor2 = IIf(Op==sup1,ColorRGB(38,0,60),IIf(Op==res1,colorGreen,colorDarkGrey));
Linecolor3 = IIf(Op==sup1,ColorRGB(27,0,70),IIf(Op==res1,colorGreen,ColorRGB(77,70,75)));
_SECTION_END();

_SECTION_BEGIN("ATR");
ParmCloud1 = ParamToggle("TrailingCloud", "No|Yes", 1);
Pp1=Param("Ray_Period1",2,1,20,1); // or 4
Pp2=Param("ATR_Period1",3,1,20,1); // or 2

avgClose = EMA((Open+High+Low+Close)/4,3) ;
avgOpen = EMA((Ref(Open,-1) + Ref(avgClose,-1))/2,3);
Temp = Max(High, avgOpen);
avgHigh = EMA(Max(Temp, avgClose),3);
Temp = Min(Low,avgOpen);
avgLow = EMA(Min(Temp, avgClose),3);
Plot(HHV(LLV(avgHigh,Pp1)-ATR(Pp2),4),"",Linecolor1 ,ParamStyle("styleLine 1",styleLine|styleThick|styleNoTitle|styleNoLabel,maskAll));
Plot(HHV(LLV(avgHigh,Pp1)-ATR(Pp2),5),"",Linecolor2 ,ParamStyle("styleLine 2",styleLine|styleThick|styleNoTitle|styleNoLabel,maskAll));
Plot(HHV(LLV(avgHigh,Pp1)-ATR(Pp2),6),"",Linecolor1 ,ParamStyle("styleLine 3",styleLine|styleThick|styleNoTitle|styleNoLabel,maskAll));
Plot(HHV(LLV(avgHigh,Pp1)-ATR(Pp2),7),"",Linecolor1 ,ParamStyle("styleLine 4",styleLine|styleThick|styleNoTitle|styleNoLabel,maskAll));


CS33=HHV(LLV(avgHigh,Pp1)-ATR(Pp2),4);
CR33=HHV(LLV(avgHigh,Pp1)-ATR(Pp2),5);
CT33=HHV(LLV(avgHigh,Pp1)-ATR(Pp2),6);
CM33=HHV(LLV(avgHigh,Pp1)-ATR(Pp2),7);

if(parmCloud1 == 1)
{
PlotOHLC( CS33, CS33, CR33,CR33, "Band1", LineColor1, styleCloud | styleNoLabel|styleNoTitle);
PlotOHLC( CR33, CR33, CT33, CT33, "Band2", LineColor2, styleCloud | styleNoLabel|styleNoTitle);
PlotOHLC( CR33, CR33, CM33, CM33, "Band3", LineColor3, styleCloud | styleNoLabel|styleNoTitle);

}


_SECTION_END();

_SECTION_BEGIN("Bands");

SupResB =Param("Sup-Res Short",6,0,100,1);
nn=SupResB;


Bandlinecol=ParamColor("SupResLineColor",ColorRGB(82,82,82));
ParmCloud = ParamToggle("Cloud", "No|Yes", 0);
BoxCloudColor=ParamColor("BoxCloudColor",ColorRGB(27,27,27));


Line2=Param("ResLineLength",100,2,500,0.1);
Daysback1    = Line2;
FirstBar1    = BarCount - DaysBack1;
Hh=HHV(flowerHigh,nn);
LL=LLV(flowerLow,nn);

Res2=Hh;
Sup2=LL;

BandRes=IIf(BarIndex() >= Firstbar1,EndValue(Res2),Null);
BandSup=IIf(BarIndex() >= Firstbar1,EndValue(Sup2),Null);
Plot(BandRes,"",Bandlinecol,ParamStyle("ShortSupBand",styleLine|styleDashed|stylehidden|styleNoTitle|styleNoLabel|styleThick,maskAll));
Plot(BandSup,"",Bandlinecol,ParamStyle("ShortResBand",styleLine|styleDashed|stylehidden|styleNoTitle|styleNoLabel|styleThick,maskAll));


CS=BandRes;
CR=BandSup;


if(parmCloud == 1)
{
	PlotOHLC( CS, CS, CR,CR, "Band",BoxCloudColor, styleCloud | styleNoLabel|styleNoTitle);
}

_SECTION_END();


_SECTION_BEGIN("TSKPPIVOT4");
CHiPr = 0;
CLoPr = 9999999;
blsLong = 0;
PrevCOBar = 0;
NumBars = 0;
PrePP = 0;
PrevLowVal = 9999999;
BuySig = 0;
blsShort = 0;
PrevHiVal = 0;
blsNewCO = 0;
BarDif   = 0;

KPA900Val = MA(C,10);
KPAutoStopVal = IIf(High,Low,Close);

// -- Create 0-initialized arrays the size of barcount
aHPivs = H - H;
aLPivs = L - L;
aHiVal = H - H;
aLoVal = L - L;

Ctmpl=Param("Ctmpl",45,1,20,1);
tskp_colortmplcnd0=colorTan;
tskp_colortmplcnd1=colorWhite;
tskp_colortmplcnd2=colorTan;
tskp_colortmplcnd3=colorWhite;
tskp_colortmplcnd4=colorTan;
tskp_colortmplcnd5=colorWhite;
tskp_colortmplcnd6=colorTan;
tskp_colortmplcnd7=colorWhite;
tskp_colortmplcnd8=colorTan;
sctotal = 0;
sctotal = sctotal  + IIf(tskp_colortmplcnd0 > 0, 1, -1);
sctotal = sctotal  + IIf(tskp_colortmplcnd1 > 0, 1, -1);
sctotal = sctotal  + IIf(tskp_colortmplcnd2 > 0, 1, -1);
sctotal = sctotal  + IIf(tskp_colortmplcnd3 > 0, 1, -1);
sctotal = sctotal  + IIf(tskp_colortmplcnd4 > 0, 1, -1);
sctotal = sctotal  + IIf(tskp_colortmplcnd5 > 0, 1, -1);
sctotal = sctotal  + IIf(tskp_colortmplcnd6 > 0, 1, -1);
sctotal = sctotal  + IIf(tskp_colortmplcnd7 > 0, 1, -1);
sctotal = sctotal  + IIf(tskp_colortmplcnd8 > 0, 1, -1);


for (curBar=0; curBar < BarCount-1; curBar++)
{

	if ( curBar == 0 )
	{
		CHiPr = flowerHigh[curBar];
		CHiBar = curBar;
		CLoPr = flowerLow[curBar];
		CLoBar = curBar;
		blsLong = 0;
		blsShort = 0;
		blsNewCO = 0;
		PrePP = 0;
		PrevCOBar = 0;
		PrevHiVal =flowerHigh[curBar];
		PrevLowVal = flowerLow[curBar];
		BuySig = 0;
		SellSig = 0;
		blsLL  = 0;
	}

	if (flowerHigh[CurBar] >= CHiPr) {
		CHiPr = flowerHigh[CurBar];
		ChiBar = CurBar;
	}

	if (flowerLow[CurBar] <= CLoPr) {
		CLoPr = flowerLow[CurBar];
		CLoBar = CurBar;
	}

	if ( (KPA900Val[curBar] >= KPAutoStopVal[curbar]) AND (PrePP != -1) AND (blsLong != 1) ){
		BarDif = CurBar - PrevCOBar;
		if (BarDif >= NumBars) {
			blsLong = 1;
			blsShort = 0;
			blsNewCO = 1;
			PrevCOBar = CurBar;
		}
	}

	if ( (KPA900Val[curBar] <= KPAutoStopVal[curbar]) AND (PrePP != 1) AND (blsShort != 1) ){
		BarDif = CurBar - PrevCOBar;
		if (BarDif >= NumBars) {
			blsLong = 0;
			blsShort = 1;
			blsNewCO = 1;
			PrevCOBar = CurBar;
		}
	}

	if ( (blsNewCO == 1) AND (sctotal[CurBar] >= 5) AND (blsLong == 1) ) {
		LVal = CurBar - CLoBar;
		for (j= CLoBar-1; j <= CLoBar+1; j++)
		{
			if (j >=0) {
				aLPivs[j] = 1;
				aLoVal[j] = CLoPr;
			}
		}
		PrePP = -1;
		blsNewCO = 0;
		CHiPr = flowerHigh[CurBar];
		CHiBar = CurBar;
		CLoPr = flowerLow[Curbar];
		CLoBar = CurBar;
		}
		else if ((blsNewCO == 1) AND (sctotal[CurBar] <= -5) AND (blsShort == 1) ) {
		HVal = CurBar - CHiBar;
		for (j= CHiBar-1; j <= CHiBar+1; j++)
		{
			if (j >=0) {
				aHPivs[j] = 1;
				aHiVal[j] = CHiPr;
			}
		}
		PrePP = 1;
		blsNewCO = 0;
		CHiPr = flowerHigh[CurBar];
		CHiBar = CurBar;
		CLoPr = flowerLow[Curbar];
		CLoBar = CurBar;
		}
}

PlotShapes(
IIf(aHPivs == 1,shapeHollowSmallCircle,shapeNone),colorYellow ,0, aHiVal+0.05, offset = 5);

PlotShapes(
IIf(aLPivs == 1,shapeHollowSmallCircle,shapeNone), colorPink,0, aLoVal-0.05, Offset = -5);
_SECTION_END();


_SECTION_BEGIN("SupRes_Short");
supresshortcolor=ParamColor("SupResShort",ColorRGB(82,82,82));

//this is for short term support line
TimeFrameSet(inWeekly);
ShortSupLenght=Param( "ShortResistLength", 4, 1, 55 ,1);
ShortSupCond1=HHV(High,ShortSupLenght);
ShortSupCond2=Close<Ref(LLV(Low,4),-1);
ShortSupA=IIf(L>Ref(ShortSupCond2,-1),1,IIf(H<Ref(ShortSupCond1,-1),-1,0));
ShortSupB=ValueWhen(ShortSupA!=0,ShortSupA,1);
ShortSupResult=IIf(ShortSupB==1,ShortSupCond1,ShortSupCond2);
TimeFrameRestore();
FinalShortSup=TimeFrameExpand(ShortSupResult,inWeekly,expandFirst);

Plot(FinalShortSup ,"ShortResistance",supresshortcolor,styleLine|styleStaircase|styleThick|styleNoRescale|styleNoLabel|styleNoTitle);


//this is for short term resistance line
TimeFrameSet(inWeekly);
ShortResLenght=Param( "ShortSupportLenght", 4, 1, 55 ,1);
ShortResCond1=Close>Ref(HHV(High,4),-1);
ShortResCond2=LLV(Low,ShortResLenght);
ShortResA=IIf(H>Ref(ShortResCond1,-1),1,IIf(L<Ref(ShortResCond2,-1),-1,0));
ShortResB=ValueWhen(ShortResA!=0,ShortResA,1);
ShortResResult=IIf(ShortResB==1,ShortResCond2,ShortResCond1);
TimeFrameRestore();
FinalShortRes=TimeFrameExpand(ShortResResult,inWeekly,expandFirst);
Plot(FinalShortRes ,"ShortSupport",supresshortcolor,styleLine|styleThick|styleStaircase|styleNoRescale|styleNoLabel|styleNoTitle);

CS=FinalShortSup;
CR=FinalShortRes;

Step = (CR-CS)/4;
KC = CS + Step;
KB = KC + Step;
KA = KB + Step;

CloudColor1 = ParamColor("CloudColor1",ColorRGB(128,31,17));
CloudColor2 = ParamColor("CloudColor2",ColorRGB(139,139,0));
CloudColor3 = ParamColor("CloudColor3",ColorRGB(1,70,1));
CloudColor4 = ParamColor("CloudColor4",ColorRGB(41,105,05));

PlotOHLC( CS, CS, KC,KC, "Band", CloudColor1, styleCloud | styleNoLabel|styleNoTitle|styleNoRescale);
PlotOHLC( KC, KC, KB,KB, "Band", CloudColor2, styleCloud | styleNoLabel|styleNoTitle|styleNoRescale);
PlotOHLC( KB, KB, KA,KA, "Band", CloudColor3, styleCloud | styleNoLabel|styleNoTitle|styleNoRescale);
PlotOHLC( KA, KA, CR,CR, "Band", CloudColor4, styleCloud | styleNoLabel|styleNoTitle|styleNoRescale);


_SECTION_END();


_SECTION_BEGIN("SupRes_Long");

supreslongcolor=ParamColor("SupReslong",ColorRGB(0,0,234));


//this is for long term resistance line
TimeFrameSet(inWeekly);
LongResLength=Param( "ResistanceLength", 30, 1, 55 ,1);
LongResCond1=HHV(H,LongResLength);
LongResCond2=Close<Ref(LLV(Low,4),-1);
LongResA=IIf(L>Ref(LongResCond2,-1),1,IIf(H<Ref(LongResCond1,-1),-1,0));
LongResB=ValueWhen(LongResA!=0,LongResA,1);
LongResResult=IIf(LongResB==1,LongResCond1,LongResCond2);
TimeFrameRestore();
FinalResResult=TimeFrameExpand(LongResResult,inWeekly,expandFirst);

Plot(FinalResResult ,"Resistance",supreslongcolor,styleLine|styleThick|styleNoRescale|styleNoLabel|styleNoTitle);


//this is for long term support line
TimeFrameSet(inWeekly);
LongSupLenght=Param( "SupportLenght", 30, 1, 55 ,1);
LongSupCond1=Close>Ref(HHV(High,4),-1);
LongSupCond2=LLV(Low,LongSupLenght);
LongSupA=IIf(H>Ref(LongSupCond1,-1),1,IIf(L<Ref(LongSupCond2,-1),-1,0));
LongSupB=ValueWhen(LongSupA!=0,LongSupA,1);
LongSupResult=IIf(LongSupB==1,LongSupCond2,LongSupCond1);
TimeFrameRestore();
FinalSupResult=TimeFrameExpand(LongSupResult,inWeekly,expandFirst);
Plot(FinalSupResult ,"Support",supreslongcolor,styleLine|styleThick|styleNoRescale|styleNoLabel|styleNoTitle);


CloudResColor=ParamColor("LongColor",ColorRGB(0,0,45));


CS1=FinalResResult;
CR1=FinalSupResult;

	PlotOHLC( CS1, CS1, CR1,CR1, "", CloudResColor, styleCloud |styleStaircase|styleNoRescale| styleNoLabel|styleNoTitle);


_SECTION_END();

_SECTION_BEGIN("PanDora");
///////////////////////////////////
Title =
EncodeColor(colorWhite)+  Title = Name () + " | "
+EncodeColor(colorYellow) + Date() + " | "

+EncodeColor(colorTurquoise)+ "Open : "+ EncodeColor(colorLightGrey)+ O + " | "
+EncodeColor(colorTurquoise)+ "High : "+ EncodeColor(colorLightGrey)+ H + " | "
+EncodeColor(colorTurquoise)+ "Low : "+ EncodeColor(colorLightGrey)+ L + " | "
+EncodeColor(colorTurquoise)+ "Close : "+ WriteIf(C> Ref(C, -1),EncodeColor(colorBrightGreen),EncodeColor(colorRed))+ C + " | "
+EncodeColor(colorTurquoise)+ "Change : ("+ WriteIf(C> Ref(C, -1),EncodeColor(colorBrightGreen),EncodeColor(colorRed)) + WriteVal(C-Ref(C,-1))+" Tk."
+EncodeColor(colorTurquoise)+ " /"+ WriteIf(C> Ref(C, -1),EncodeColor(colorBrightGreen),EncodeColor(colorRed))+ WriteVal( ROC( C, 1 ))+""+ " % "
+EncodeColor(colorTurquoise)+ ") | Volume : " + WriteIf(V> Ref(V, -1),EncodeColor(colorBrightGreen),EncodeColor(colorRed))+ WriteVal(V,1)
;

/////////////////////////////////////////////////////////
//																//
//			General Market Exploration by XeL				//
//																//
//						Ver: 1.00.beta						//
//																//
//	Free to Distribute under LGPL 2012	.					//
//	Portions of Code are property of their original		//
//	authors, Cleaning, some new code and Preparation	//
//	are derived by @XeL_Arjona.								//
//	Some Original Code credits:								//
//																//
//	*	Volume Price Analysis by Karthikmarar				//
//			http://vpanalysis.blogspot.mx/					//
//																//
//	*	Jurik Research DMX (Free)							//
//			http://jurikres.com/catalog/ms_dmx.htm		//
//																//
//	*	Extract of some exploration Methodology			//
//		by Manish.												//
//																//
//																//
/////////////////////////////////////////////////////////


/////////////////
//  AFL START  //
/////////////////

//_SECTION_BEGIN("VPA, Momentum & Signal Explorer by XeL");


//////////////////////
// Main Variables   //
//////////////////////
// Count Index value for TrendScore
	i	=	0;
// Display Colors
// Main Color
	Color_buy		=	colorLime				;
	Color_bull		=	colorGreen				;
	Color_bull1	=	colorDarkYellow		;
	Color_bear1	=	colorLightOrange		;
	Color_bear		=	colorOrange			;
	Color_sell		=	colorRed				;
	Color_prev		=	colorGold				;
	Color_acc		=	colorPaleTurquoise	;
	Color_null		=	colorLightGrey		;
//	Background Colors
	BColor_vpa		=	colorBlack				;
	BColor_mas		=	colorDefault			;
	BColor_mam		=	colorDefault			;
	BColor_mal		=	colorDefault			;
//	Alternate Colors
	Color_acc1		=	colorBlueGrey			;

// 52 High Low
High52		=	HHV(High,250);
Low52		=	LLV(Low,250);
// T3 Function
function T3(price,periods)
	{
		s = 0.84;
		e1=EMA(price,periods);
		e2=EMA(e1,Periods);
		e3=EMA(e2,Periods);
		e4=EMA(e3,Periods);
		e5=EMA(e4,Periods);
		e6=EMA(e5,Periods);
		c1=-s*s*s;
		c2=3*s*s+3*s*s*s;
		c3=-6*s*s-3*s-3*s*s*s;
		c4=1+3*s+s*s*s+3*s*s;
		Ti3=c1*e6+c2*e5+c3*e4+c4*e3;
		return ti3;
	}


////////////////////////////////////////////////
// Time to Date % Change and Beta Correlation //
////////////////////////////////////////////////
_SECTION_BEGIN("P/L % Change over Time with Beta Correlation");
// PARAMETERS
	TtD_Param		=	ParamList("Period","Day to Date|Week to Date|Month to Date|Year to Date",0);
	IDX_Param		=	ParamStr("Reference Market Index Symbol","$IME-MEX");
// VARIABLES
	FDayMonth		=	BarsSince(Month() != Ref(Month(),-1));
	FDayYear		=	BarsSince(Year() != Ref(Year(),-1));
	TtD_Period		=	IIf(TtD_Param	==	"Day to Date",1,
						IIf(TtD_Param	==	"Week to Date",DayOfWeek(),
						IIf(TtD_Param	==	"Month to Date",FDayMonth,
						IIf(TtD_Param	==	"Year to Date",FDayYear,0))));
	IDX_Close		=	Foreign(IDX_Param,"Close");
// FORMULA
//		P/L % Change
	TtD_Change		= 100 * (Close - Ref(Close, -TtD_Period) ) / Ref(Close, -TtD_Period);
//		Beta Correlation in Time from Index
	Beta			=	(( TtD_Period * Sum(ROC( C,1) * ROC(IDX_Close,1),TtD_Period )) -
						(Sum(ROC(C,1),TtD_Period) *
						Sum(ROC( IDX_Close,1),TtD_Period))) /
						((TtD_Period * Sum((ROC(IDX_Close,1)^2 ),TtD_Period)) -
						(Sum(ROC(IDX_Close,1 ),TtD_Period)^2 ));
_SECTION_END();


///////////////////////////
// Volume Price Analysis //
///////////////////////////
_SECTION_BEGIN("Volume Price Analysis");
// FORMULA
	SetChartOptions(0,chartShowArrows|chartShowDates);
	DTL=Param("Linear regression period",60,10,100,10);
	wbf=Param("WRB factor",1.5,1.3,2.5,.1);
	nbf=Param("NRB factor",0.7,0.3,0.9,0.1);
	TL=LinRegSlope(MA(C, DTL),2);
	Vlp=Param("Volume lookback period",30,20,300,10);
	Vrg=MA(V,Vlp);
	St = StDev(Vrg,Vlp);
	Vp3 = Vrg + 3*st;
	Vp2 = Vrg + 2*st;;
	Vp1 = Vrg + 1*st;;
	Vn1 = Vrg -1*st;
	Vn2 = Vrg -2*st;
	rg=(H-L);
	arg=Wilders(rg,30);
	wrb=rg>(wbf*arg);
	nrb=rg<(nbf*arg);
	Vl=V<Ref(V,-1) AND V<Ref(V,-2);
	upbar=C>Ref(C,-1);
	dnbar=C<Ref(C,-1);
	Vh=V>Ref(V,-1) AND Ref(V,-1)>Ref(V,-2);
	Cloc=C-L;
	x=rg/Cloc;
	x1=IIf(Cloc=0,arg,x);
	Vb=V>Vrg OR V>Ref(V,-1);
	ucls=x1<2;
	dcls=x1>2;
	mcls=x1<2.2 AND x1>1.8 ;
	Vlcls=x1>4;
	Vhcls=x1<1.35;
	j=MA(C,5);
	TLL=LinRegSlope(j,40) ;
	Tlm=LinRegSlope(j,15) ;
	tls=LinRegSlope(j,5);
	mp=(H+L)/2;
// VOLUME VARIABLES
//		TrendScore Count
	IIf( V>Vp2, i+3,i);
	IIf( V>Vp1, i+2,i);
	IIf( V>VRG, i+1,i);
//		Indicators
	VPAv_Status	=	WriteIf( V>Vp2,	"VERY HIGH",
						WriteIf( V>Vp1,	"High",
						WriteIf( V>Vrg,	"Above Average",
						WriteIf( V<Vrg AND V>Vn1, "Less than Average",
						WriteIf( V<Vn1, "L o w", "" )))));
	VPAv_Color	=		IIf( V>Vp2, Color_buy,
						IIf( V>Vp1, Color_bull,
						IIf( V>Vrg, Color_bull1,
						IIf( V<Vrg AND V>Vn1, Color_bear,
						IIf( V<Vn1, Color_sell, Color_null )))));

// SPREAD VARIABLES
//		Indicators
	IIf( rg>(arg*2), i+2,i);
	IIf( rg>arg, i+1,i);
	VPAs_Status	=	WriteIf( rg>(arg*2), "Wide",
						WriteIf( rg>arg, "Above Average","Narrow"));
	VPAs_Color		=	IIf( rg>(arg*2), Color_buy,
						IIf( rg>arg, Color_bull,Color_bear));

// CLOSE VARIABLES
//		TrendScroe Count
	IIf( Vhcls, i+2,i);
	IIf( ucls, i+1,1);
//		Indicators
	VPAc_Status	=	WriteIf( Vhcls, "VERY HIGH",
						WriteIf( ucls, "High",
						WriteIf( mcls, "Mid",
						WriteIf( dcls, "Down","VERY LOW"))));
	VPAc_Color		=	IIf( Vhcls, Color_buy,
						IIf( ucls, Color_bull,
						IIf( mcls, Color_bull1,
						IIf( dcls, Color_bear,Color_sell))));

// VOLUME ZONE
// FORMULA
	C1 = Ref(C, -1);
	uc = C > C1; dc = C <= C1;
	ud = C > O; dd = C <= O;
	green = 1; blue = 2; yellow = 3; red = 4; white = 5;
	VType = IIf(ud,
	         IIf(uc, green, yellow),
	       IIf(dd,
	         IIf(dc, red, blue), white));
	/* green volume: up-day and up-close*/
	gv = IIf(VType == green, V, 0);
	/* yellow volume: up-day but down-close */
	yv = IIf(VType == yellow, V, 0);
	/* red volume: down-day and down-close */
	rv = IIf(VType == red, V, 0);
	/* blue volume: down-day but up-close */
	bv = IIf(VType == blue, V, 0);
	uv = gv + bv; uv1 = Ref(uv, -1); /* up volume */
	dv = rv + yv; dv1 = Ref(dv, -1); /* down volume */
	VolPer = Param("Adjust Vol. MA per.", 34, 1, 255, 1);//12
	ConvPer = Param("Adjust Conv. MA per.", 9, 1, 255, 1);//6
	MAuv = TEMA(uv, VolPer ); mauv1 = Ref(mauv, -1);
	MAdv = TEMA(dv, VolPer ); madv1 = Ref(madv, -1);
	MAtv = TEMA(V, VolPer );//total volume
	Converge = (TEMA(MAuv - MAdv, ConvPer));
	Converge1 = Ref(Converge, -1);
	ConvergeUp = Converge > Converge1;
	ConvergeOver = Converge > 0;
	rising = ConvergeUp AND ConvergeOver;
	falling = !ConvergeUp AND ConvergeOver;
// VOLUME ZONE
// VARIABLES
//		TrendScore Count
	IIf( rising, i+1,i);
//		Indicators
	VPAz_Status	=	WriteIf(rising,"Accumulation",
						WriteIf(falling,"Distribution","Flat"));
	VPAz_Color		=	IIf(rising,Color_acc,
						IIf(falling,Color_prev,Color_null));

// VOLUME STATUS
// PARAMETERS
	Pp1=Param("Number Of Days",30,1,200,1);
	Pp2=Param("Volume Of Days",15,1,200,1);
// FORMULA
	numDays = Pp1;
	dwWideSpread = 1.8;
	dwNarrowSpread = 0.8;
	dwSpreadMiddle = 0.5;
	dwHighClose = 0.7;
	dwLowClose = 0.3;
	volNumDays = Pp2;
	dwUltraHighVol = 2;
	dwVeryHighVol = 1.75; // was 1.8
	dwHighVol = 1.75; // was 1.8
	dwmoderateVol = 1.10; // was 1.8
	dwLowVol = 0.75; // was 0.8
	/* Classify each bar... */
	upBar = C > Ref(C,-1);
	downBar = C < Ref(C,-1);
	spread = H-L;
	avgRange = Sum(spread, numDays) / numDays;
	wideRange = spread >= (dwWideSpread * avgRange);
	narrowRange = spread <= (dwNarrowSpread * avgRange);
	testHighClose = L + (spread * dwHighClose);
	testLowClose = L + (spread * dwLowClose);
	testCloseMiddle = L + (spread * dwSpreadMiddle);
	upClose = C > testHighClose;
	downClose = C < testLowClose;
	middleClose = C >= testLowClose AND C <= testHighClose;
	avgVolume = EMA(V, volNumDays);
	highVolume = V > (avgVolume * dwHighVol);
	moderateVol= V > (avgVolume * dwmoderateVol);
	veryHighVolume = V > (avgVolume * dwVeryHighVol);
	ultraHighVolume = V > (avgVolume * dwUltraHighVol);
	LowVolume = V < (avgVolume * dwLowVol);
	/* direction AND Title */
	/* Basic patterns... */
	upThrustBar = downClose AND H > Ref(H,-1) AND (C == L) AND downClose AND (NOT narrowRange);
	noDemandBar = narrowRange AND LowVolume AND upBar AND (NOT upClose);
	//noDemandBar = narrowRange AND LowVolume AND upBar AND (V < Ref(V,-1)) AND (V < Ref(V,-2));
	noSupplyBar = narrowRange AND LowVolume AND downBar AND (V < Ref(V,-1)) AND (V < Ref(V,-2));
	absorption = Ref(downbar, -1) AND Ref(highVolume, -1) AND upBar;
	support = Ref(downBar,-1) AND (NOT Ref(downClose,-1)) AND Ref(highVolume,-1) AND upBar;
	stoppingVolume = Ref(downBar,-1) AND Ref(highVolume,-1) AND C > testCloseMiddle AND (NOT downBar);
	bullishsign=moderateVol+UpThrustBar;//OR moderateVol+upBar;
	//rallyEnd = (Ref(highVolume,-1) AND Ref(upBar,-1) AND wideRange AND downBar) OR
	// (narrowRange AND highVolume AND H > Ref(HHV(H, 250), -1));
	/* Strength AND Weakness */
	weakness = upThrustBar OR noDemandBar OR
	(narrowRange AND (H > Ref(H,-1)) AND highVolume) OR
	(Ref(highVolume,-1) AND Ref(upBar,-1) AND downBar AND (H < Ref(H,-1)));
// VARIABLES
//		TrendScore Count
	IIf( bullishsign, i+3,i);
	IIf( upThrustBar, i+2,i);
	IIf( absorption, i+1,i);
//		Indicators
	VPAst_Status	=	WriteIf(Weakness,"W e a k",
						WriteIf(StoppingVolume,"Stopping Volume",
						WriteIf(noSupplyBar,"No Supply",
						WriteIf(support,"Support",
						WriteIf(noDemandBar,"No Demand",
						WriteIf(absorption,"Absorption",
						WriteIf(upThrustBar,"Up Thrust",
						WriteIf(bullishsign,"-=STRONG=-","Neutral"))))))));
	VPAst_Color	=	IIf(Weakness,Color_sell,
						IIf(StoppingVolume,Color_bear,
						IIf(noSupplyBar,Color_bear1,
						IIf(support,Color_bear,
						IIf(noDemandBar,Color_prev,
						IIf(absorption,Color_bull1,
						IIf(upThrustBar,Color_bull,
						IIf(bullishsign,Color_buy,Color_null))))))));
_SECTION_END();


//////////////////////////
// EMA Terms and Trend  //
//////////////////////////
_SECTION_BEGIN("EMA Short, Mid and Long Terms and Trend");
// PARAMETERS
	EMAs1Pds	=	Param("1st. Short Term Period",9,5,14,1);
	EMAs2Pds	=	Param("2nd. Short Term Period",20,15,45,1);
	EMAmPds	=	Param("Mid Term Period",50,46,90,1);
	EMAlPds	=	Param("Long Term Perdiod",200,100,300,1);
// FORMULA
//	EMA Short term signals
	EMAsBuy	=	Cross(EMA(C,EMAs1Pds), EMA(C,EMAs2Pds));
	EMAsSell	=	Cross(EMA(C,EMAs2Pds),EMA(C,EMAs1Pds));
	EMAsBuy	=	ExRem(EMAsBuy, EMAsSell);
	EMAsSell	=	ExRem(EMAsSell, EMAsBuy);
	EMAsBull	=	EMA(C,EMAs1Pds) > EMA(C,EMAs2Pds);
	EMAsBear	=	EMA(C,EMAs1Pds) < EMA(C,EMAs2Pds);
//	EMA Mid term signals
	EMAmBuy	=	Cross(EMA(C,(EMAs1Pds+EMAs2Pds)/2), EMA(C,EMAmPds));
	EMAmSell	=	Cross(EMA(C,EMAmPds), EMA(C,(EMAs1Pds+EMAs2Pds)/2));
	EMAmBuy	=	ExRem(EMAmBuy, EMAmSell);
	EMAmSell	=	ExRem(EMAmSell, EMAmBuy);
	EMAmBull	=	C > EMA(C,EMAmPds);
	EMAmBear	=	C < EMA(C,EMAmPds);
//	EMA Long term signals
	EMAlBuy	=	Cross(EMA(C,EMAmPds), EMA(C,EMAlPds));
	EMAlSell	=	Cross(EMA(C,EMAlPds), EMA(C,EMAmPds));
	EMAlBuy	=	ExRem(EMAlBuy, EMAlSell);
	EMAlSell	=	ExRem(EMAlSell, EMAlBuy);
	EMAlBull	=	C > EMA(C,EMAlPds);
	EMAlBear	=	C < EMA(C,EMAlPds);
// EMA Positional Price Trend (Long-Term)
	EMA_rc		=	C > EMA (C,EMAmPds) AND C < EMA(C,EMAlPds) AND EMA(C,EMAmPds) < EMA(C,EMAlPds);
	EMA_ac		=	C > EMA (C,EMAmPds) AND C > EMA(C,EMAlPds) AND EMA(C,EMAmPds) < EMA(C,EMAlPds);
	EMA_bl		=	C > EMA (C,EMAmPds) AND C > EMA(C,EMAlPds) AND EMA(C,EMAmPds) > EMA(C,EMAlPds);
	EMA_pr		=	C < EMA (C,EMAmPds) AND C > EMA(C,EMAlPds) AND EMA(C,EMAmPds) > EMA(C,EMAlPds);
	EMA_ds		=	C < EMA (C,EMAmPds) AND C < EMA(C,EMAlPds) AND EMA(C,EMAmPds) > EMA(C,EMAlPds);
	EMA_br		=	C < EMA (C,EMAmPds) AND C < EMA(C,EMAlPds) AND EMA(C,EMAmPds) < EMA(C,EMAlPds);
// VARIABLES
//		TrendScore Count
	IIf(EMAsBuy,i+1,i);
	IIf(EMAmBuy,i+1,i);
	IIf(EMAlBuy,i+1,i);
	IIf(EMA_rc,i+3,i);
	IIf(EMA_ac,i+2,i);
	IIf(EMA_bl,i+1,1);
	EMAs_Status	=	WriteIf(EMAsBuy, "-=BUY=-",
						WriteIf(EMAsSell, "-=SELL=-",
						WriteIf(EMAsBull, "Bullish",
						WriteIf(EMAsBear, "Bearish","Neutral"))));
	EMAs_Color		=	IIf(EMAsBuy, Color_buy,
						IIf(EMAsBull, Color_bull,
						IIf(EMAsBear, Color_bear,
						IIf(EMAsSell, Color_sell,Color_null))));
	EMAm_Status	=	WriteIf(EMAmBuy, "-=BUY=-",
						WriteIf(EMAmSell, "-=SELL=-",
						WriteIf(EMAmBull, "Bullish",
						WriteIf(EMAmBear, "Bearish","Neutral"))));
	EMAm_Color		=	IIf(EMAmBuy, Color_buy,
						IIf(EMAmBull, Color_bull,
						IIf(EMAmBear, Color_bear,
						IIf(EMAmSell, Color_sell,Color_null))));
	EMAl_Status	=	WriteIf(EMAlBuy, "-=BUY=-",
						WriteIf(EMAlSell, "-=SELL=-",
						WriteIf(EMAlBull, "Bullish",
						WriteIf(EMAlBear, "Bearish","Neutral"))));
	EMAl_Color		=	IIf(EMAlBuy, Color_buy,
						IIf(EMAlBull, Color_bull,
						IIf(EMAlBear, Color_bear,
						IIf(EMAlSell, Color_sell,Color_null))));
	EMAp_Status	=	WriteIf(EMA_rc, "RECOVERY",
						WriteIf(EMA_ac, "Accumulation",
						WriteIf(EMA_bl, "Bullish",
						WriteIf(EMA_pr, "Preventive",
						WriteIf(EMA_ds, "Distribution",
						WriteIf(EMA_br, "Bearish","Neutral"))))));
	EMAp_Color		=	IIf(EMA_rc, Color_buy,
						IIf(EMA_ac, Color_acc1,
						IIf(EMA_bl, Color_bull,
						IIf(EMA_pr, Color_prev,
						IIf(EMA_ds, Color_bear1,
						IIf(EMA_br, Color_bear,Color_null))))));
_SECTION_END();


////////////////////////
// Initial Buy signal //
////////////////////////
_SECTION_BEGIN("IBuy Signal");
// FORMULA
	I_buy =  Cross(RSI(14), EMA(RSI(14),9));
	I_sell = Cross(EMA(RSI(14),9), RSI(14));
	I_buy = ExRem(I_buy, I_sell);
	I_sell = ExRem(I_sell, I_buy);
	I_bull = RSI(14) > EMA(RSI(14),9);
	I_bear = RSI(14) < EMA(RSI(14),9);
// VARIABLES
//		TrendScore Count
	IIf(I_buy,i+2,i);
	IIf(I_bull,i+1,i);
//		Indicators
	I_Status	=	WriteIf(I_buy,"-=BUY=-",
					WriteIf(I_bull,"Bullish",
					WriteIf(I_bear,"Bearish",
					WriteIf(I_sell,"-=SELL=-","Neutral"))));
	I_Color	=	IIf(I_buy,Color_buy,
					IIf(I_bull,Color_bull,
					IIf(I_bear,Color_bear,
					IIf(I_sell,Color_sell,Color_null))));
_SECTION_END();


/////////////////////
// Price Smoothing //
/////////////////////
_SECTION_BEGIN("T3 Price Smoothing Signal");
// FORMULA
	T3_buy		=	Cross (T3(C,3), T3(C,5));
	T3_sell	=	Cross (T3(C,5), T3(C,3));
	T3_buy		=	ExRem(T3_buy, T3_sell);
	T3_sell	=	ExRem(T3_sell, T3_buy);
// VARIABLES
//		TrendScore Count
	IIf(T3_buy,i+1,i);
//		Indicators
	T3_Status	=	WriteIf(T3_buy,"-=BUY=-",
					WriteIf(T3_sell,"-=SELL=-","Neutral"));
	T3_Color	=	IIf(T3_buy,Color_buy,
					IIf(T3_sell,Color_sell,Color_null));
_SECTION_END();


////////////////////
// Bollinger Band //
////////////////////
_SECTION_BEGIN("Bollinger Bands");
// FORMULA
	BB1			=	C>BBandTop(C,20,2) AND Ref(C,-1)<Ref(BBandTop(C,20,2),-1);
	BB2			=	C<BBandBot(C,20,2) AND Ref(C,-1)>Ref(BBandBot(C,20,2),-1);
// VARIABLES
//		TrendScore Count
	IIf(BB1,i+1,i);
//		Indicators
	BB_Status	=	WriteIf(BB1,"Above Top",
					WriteIf(BB2,"Below Bottom",
					WriteIf(IsNull(MA(C,20)),"N/A","Neutral")));
	BB_Color	=	IIf(BB1,Color_bull,
					IIf(BB2,Color_bear,Color_null));
_SECTION_END();


//////////
// MACD //
//////////
_SECTION_BEGIN("MACD Signal");
// FORMULA
	MACDBull		=	MACD(12,26)>Signal(12,26,9);
// VARIABLES
//		TrendScore Count
	IIf(MACDBull,i+1,i);
//		Indicators
	MACD_Status		=	WriteIf(MACDBull,"Bullish",
							WriteIf(IsNull(MACD(12,26)),"N/A","Bearish"));
	MACD_Color			=	IIf(MACDBull,Color_bull,
							IIf(IsNull(MACD(12,26)),Color_null,Color_bear));
_SECTION_END();


/////////////////
// RSI of MACD //
/////////////////
_SECTION_BEGIN("RSI of MACD Signal");
// PARAMETERS
	RSItPds=Param("Period",14,7,33,1);
	RSItOb_Parm=Param("OverBought Level",70,-200,200,5);
	RSItOs_Parm=Param("OverSold Level",30,-200,200,5);
// FORMULA
	Var=MACD();
	Up=IIf(Var>Ref(Var,-1),abs(Var-Ref(Var,-1)),0);
	Dn=IIf(Var<Ref(Var,-1),abs(Var-Ref(Var,-1)),0);
	Ut=Wilders(Up,RSItPds);
	Dt=Wilders(Dn,RSItPds);
	RSIt=100*(Ut/(Ut+Dt));
	//RSItBuy	=	RSIt < RSItOs_Parm AND RSIt > Ref(RSIt,-1);
	//RSItOs		=	RSIt < RSItOs_Parm AND RSIt < Ref(RSIt,-1);
	//RSItNu		=	RSIt < RSItOs_Parm AND RSIt > RSItOb_Parm AND RSIt > Ref(RSIt,-1);
	//RSItNd		=	RSIt < RSItOs_Parm AND RSIt > RSItOb_Parm AND RSIt < Ref(RSIt,-1);
	//RSItOb		=	RSIt <	RSItOb_Parm AND RSIt > Ref(RSIt,-1);
	//RSItSell		=	RSIt <	RSItOb_Parm AND RSIt < Ref(RSIt,-1);
	RSItOs			=	RSIt < RSItOs_Parm;
	RSItOb			=	RSIt > RSItOb_Parm;
	// VARIABLES
	//		TrendScore Count
	IIf(RSItOs, i+1,i);
	//		Indicators
	RSIt_Status	=	WriteIf(RSItOs,"OverSold",
						WriteIf(RSItOb,"OverBought","In Range"));
	RSIt_Color	=		IIf(RSItOs,Color_bull,
						IIf(RSItOb,Color_sell,Color_null));
_SECTION_END();


///////////
// Aroon //
///////////
//_SECTION_BEGIN("AROON Signal");
//// PARAMETERS
//	ArPeriod=Param("Period",14,7,33,1);
//// FORMULA
//	LLVBarsSince=LLVBars(L,ArPeriod)+1;
//	HHVBarsSince=HHVBars(H,ArPeriod)+1;
//	AroonDown=100*(ArPeriod-LLVBarsSince)/(ArPeriod-1);
//	AroonUp=100*(ArPeriod-HHVBarsSince)/(ArPeriod-1);
//	AroonOsc=AroonUp-AroonDown;
//	Aroon=AroonOsc>0;
//// VARIABLES
//	IIf(Aroon,i+1,i);
//	AROON_Status	=	WriteIf(Aroon,"Bullish",
//						WriteIf(IsNull (RSI(14)),"N/A","Bearish"));
//	AROON_Color	=	IIf(Aroon,Color_bull,
//						IIf(IsNull(RSI(14) ),Color_null,Color_bear));
//_SECTION_END();


/////////
// WAD //
/////////
//_SECTION_BEGIN("Williams Accumulation-Distribution Signal");
// PARAMETERS
//	WADPds=Param("Period",20,7,33,1);
	// FORMULA
//	TrueRangeHigh=Max( Ref(Close,-1), High );
//	TrueRangeLow=Min( Ref(Close,-1), Low );
//	WAD = Cum(IIf(C > Ref(C,-1),C-TrueRangeLow, IIf(C < Ref(C,-1),C-TrueRangeHigh,0)));
//	wadup = WAD > EMA (WAD,WADPds);
//	waddn = WAD < EMA (WAD,WADPds);
//	wadbl = Cross(WAD, EMA(WAD,WADPds));
//	wadbr = Cross(EMA(WAD,WADPds), WAD);
// VARIABLES
//	WAD_Status	=	WriteIf(wadup, "Bullish Zone",
//					WriteIf(waddn, "Bearish Zone",
//					WriteIf(wadbl, "Bullish Cross",
//					WriteIf(wadbr, "Bearish Cross","Neutral"))));
//	WAD_Color	=	IIf(wadup,Color_bull,
//					IIf(wadbl,Color_bear,
//					IIf(wadbr,Color_bull1,
//					IIf(waddn,Color_bear1,Color_null))));
//_SECTION_END();


/////////////
// Coppock //
/////////////
_SECTION_BEGIN("Coppock Indicator");
// FORMULA
	CKr1=ROC(C,14);
	CKr2=ROC(C,11);
	CK=EMA((CKr1+CKr2),10);
	CK_upt=IIf(ck>0 AND ROC(ck,1)>0,ck,0);
	CK_ups=IIf(ck>0 AND ROC(ck,1)<0,ck,0);
	CK_dws=IIf(ck<0 AND ROC(ck,1)>0,ck,0);
	CK_dwt=IIf(ck<0 AND ROC(ck,1)<0,ck,0);
// VARIABLES
//		TrendScore Count
	IIf(CK_upt,i+2,i);
	IIf(CK_ups,i+1,i);
//		Indicators
	Coppock_Status	=	WriteIf( CK_upt,"UPTREND",
							WriteIf( CK_ups,"UpT Sideways",
							WriteIf( CK_dws,"DnT Sideways",
							WriteIf( CK_dwt,"DownTrend","Flat"))));
	Coppock_Color		=	IIf( CK_upt,Color_buy,
							IIf( CK_ups,Color_bull,
							IIf( CK_dws,Color_bear,
							IIf( CK_dwt,Color_sell,Color_null))));
_SECTION_END();


////////////////
// Stochastic //
////////////////
_SECTION_BEGIN("Stochastic %D %K Signal");
// FORMULA
	StochKBull		=	StochK(14,3)>StochD(14,3,3);
// VARIABLES
//		TrendScore Count
	IIf(StochKBull,i+1,i);
//		Indicators
	STOCH_Status	=	WriteIf( StochKBull,"Bullish",
						WriteIf( IsNull(StochK(14,3)),"N/A","Bearish"));
	STOCH_Color	=	IIf(StochKBull,Color_bull,
						IIf( IsNull(StochK(14,3)),Color_null,Color_bear));
_SECTION_END();


//////////
// ARSI //
//////////
_SECTION_BEGIN("ARSI Signal");
// PARAMETERS
	ARSI_Pds		=	Param("Period",14,7,33,1);
	ARSIOb_Parm	=	Param("OverBought Level",70,-200,200,5);
	ARSIOs_Parm	=	Param("OverSold Level",30,-200,200,5);
// FORMULA
	Chg 			=	C - Ref( C, -1 );
	UpCount		=	Sum( Chg >= 0, ARSI_Pds );
	DnCount		=	ARSI_Pds - UpCount;
	UpMove			=	AMA( Max( Chg, 0 ), Nz(1/UpCount) );
	DnMove			=	AMA( Max( -Chg, 0 ), Nz(1/DnCount) );
	RS				=	UpMove/DnMove;
	ARSI			=	100-(100/(1+RS));
	ARSIOs			=	ARSI < ARSIOs_Parm;
	ARSIOb			=	ARSI > ARSIOb_Parm;
	//ARSIUt		=	ARSI > Ref(ARSI,-1);
	//ARSIDt		=	ARSI < Ref(ARSI,-1);
	//ARSIBuy		=	ARSI < ARSIOs AND ARSIUt;
	//ARSISell		=	ARSI >	ARSIOb AND ARSIDt;
	//ARSIBuy		=	ExRem(ARSIBuy, ARSISell);
	//ARSISell		=	ExRem(ARSISell,ARSIBuy);
// VARIABLES
//		TrendScroe Count
	IIf(ARSIOs,i+1,i);
//		Indicators
	ARSI_Status		=	WriteIf(ARSIOs,"OverSold",
							WriteIf(ARSIOb,"OverBought","In Range"));
							//WriteIf(ARSIBuy,"-=BUY=-",
							//WriteIf(ARSI>ARSIOs,"OverSold",
							//WriteIf(ARSIUt,"Improving",
							//WriteIf(ARSIDt,"Declining",
							//WriteIf(ARSI<ARSIOb,"OverBought",
							//WriteIf(ARSISell,"-=SELL=-",""))))));
	ARSI_Color		=		IIf(ARSIOs,Color_bull,
							IIf(ARSIOb,Color_sell,Color_null));
							//IIf(ARSIBuy,Color_buy,
							//IIf(ARSI>ARSIOs,Color_bull,
							//IIf(ARSIUt,Color_bull1,
							//IIf(ARSIDt,Color_bear1,
							//IIf(ARSI<ARSIOb,Color_bear,
							//IIf(ARSISell,Color_sell,Color_null))))));
_SECTION_END();


/////////
// RSI //
/////////
//_SECTION_BEGIN("RSI Signal");
// PARAMETERS
//	RSIPds=Param("Period",14,7,33,1);
//	RSIOb=Param("OverBought Level",70,-200,200,5);
//	RSIOs=Param("OverSold Level",30,-200,200,5);
// FORMULA
//	R1=RSI(RSIPds)>RSIOs AND Ref(RSI(RSIPds),-1)<RSIOs AND Ref(RSI(RSIPds),-2)<RSIOs;
//	R2=RSI(RSIPds)<RSIOb AND Ref(RSI(RSIPds),-1)>RSIOb AND Ref(RSI(RSIPds),-2)>RSIOb;
// VARIABLES
//	IIf(R1,i+1,i);
//	RSI_Status		=	WriteIf(R1,"Improving",
//						WriteIf(R2,"Declining",
//						WriteIf(IsNull(RSI(14)),"N/A","Neutral")));
//	RSI_Color		=	IIf(R1,Color_bull1,
//						IIf(R2,Color_bear1,Color_null));
//_SECTION_END();


/////////
// MFI //
/////////
_SECTION_BEGIN("MFI Signal");
// PARAMETERS
	MFIPds=Param("Period",14,7,33,1);
	MFIOb=Param("OverBought Level",80,-200,200,5);
	MFIOs=Param("OverSold Level",20,-200,200,5);
// FORMULA
	M1=MFI(MFIPds)>MFIOb;
	M2=MFI(MFIPds)<MFIOs;
//	VARIABLES
//		TrendScroe Count
	IIf(M2,i+1,i);
//		Indicators
	MFI_Status		=	WriteIf(M1,"OverBought",
						WriteIf(M2,"OverSold",
						WriteIf(IsNull(MFI(MFIPds)),"Null","Neutral")));
	MFI_Color		=	IIf(M1,Color_sell,
						IIf(M2,Color_buy,Color_null));
_SECTION_END();


/////////////////////////////////
// ADX Trend Strenght with ADX //
/////////////////////////////////
_SECTION_BEGIN("ADX Signal");
// JSB Lib Version
// INITIALIZATION
	SetBarsRequired(100000, 100000);
//	JSB_InitLib();
// PARAMETERS
	ADX_Parm	=	Param( "ADX Period", 8, 5, 50,1);
	ADX_Parma	=	Param( "ADX Perioda", 15, 5, 50,1);
	ADX_Parmb	=	Param( "ADX Periodb", 25, 5, 50,1);
	ADX_Parmc	=	Param( "ADX Periodc", 35, 5, 50,1);
	ADX_Parmd	=	Param( "ADX Periodd", 50, 5, 50,1);
// FORMULA
//	ADX Buy, Sell & Choppy Signal
	ADX_up		=	MA(C,ADX_Parm) > 0;
	ADX_dn		=	MA(C,ADX_Parm) < 0;
	ADX_ch		=	MA(C,ADX_Parma) < MA(C,ADX_Parmb) AND MA(C,ADX_Parmc) < MA(C,ADX_Parmd);
	ADX_Buy	=	Cross(MA(C,ADX_Parm), MA(C,ADX_Parmb));
	ADX_Sell	=	Cross(MA(C,ADX_Parmb), MA(C,ADX_Parm));
	ADX_Buy	=	ExRem(ADX_Buy, ADX_Sell);
	ADX_Sell	=	ExRem(ADX_Sell, ADX_Buy);
	ADX_bull	=	MA(C,ADX_Parm) > MA(C,ADX_Parmb);
	ADX_bear	=	MA(C,ADX_Parm)> MA(C,ADX_Parma);
// ADX Trend Confirmation Signal
	ADXwk		=	ADX(ADX_Parm) < 25;
	ADXst		=	ADX(ADX_Parm) > 25 AND ADX(ADX_Parm) < 50;
	ADXvs		=	ADX(ADX_Parm) > 50 AND ADX(ADX_Parm) < 75;
	ADXex		=	ADX(ADX_Parm) > 75 AND ADX(ADX_Parm) < 100;
	ADXchoppy	=	ADX(ADX_Parm) < PDI(ADX_Parm) AND ADX(ADX_Parm) < MDI(ADX_Parm);
// VARIABLES
//		TrendScore Count
	IIf(ADX_Buy,i+2,i);
	IIf(ADX_bull,i+1,i);
//	IIf(ADXst,i+1,i);
//		Indicators
	ADX_Status		=	WriteIf(ADX_Buy,"-=BUY=-",
						WriteIf(ADX_bull,"Bullish",
						WriteIf(ADX_bear,"Bearish",
						WriteIf(ADX_Sell,"-=SELL=-","Neutral"))));
	ADX_Color		=	IIf(ADX_Buy,Color_buy,
						IIf(ADX_bull,Color_bull,
						IIf(ADX_bear,Color_bear,
						IIf(ADX_Sell,Color_sell,Color_null))));
	//ADXc_Status	=	WriteIf(ADXwk,"Weak",
	//					WriteIf(ADXst,"Good",
	//					WriteIf(ADXvs,"Strong",
	//					WriteIf(ADXex,"EXCELENT",
	//					WriteIf(ADXchoppy,"Choppy","Neutral")))));
	//ADXc_Color		=	IIf(ADXwk,Color_sell,
	//					IIf(ADXst,Color_bull1,
	//					IIf(ADXvs,Color_bull,
	//					IIf(ADXex,Color_buy,
	//					IIf(ADXchoppy,Color_prev,Color_null)))));
_SECTION_END();


_SECTION_BEGIN("Unnamed 1");


threshold = 5;
uptrend = StochK(39,3) > StochD(39,3,3);
downtrend =StochK(39,3) < StochD(39,3,3);

Buy = uptrend AND H >= Ref(H,-1) + threshold; BuyPrice = Max(O,Ref(H,-1) + threshold);
Sell = downtrend AND L <= Ref(L,-1) - threshold; SellPrice = Min(O,Ref(L,-1) - threshold);

Buy = ExRem(Buy,Sell);
Sell = ExRem(Sell,Buy);
Cover=Buy;
Short=Sell;
SellPrice=ValueWhen(Short,C,1);
BuyPrice=ValueWhen(Buy,C,1);

PlotShapes(IIf(Buy, shapeSquare, shapeNone),colorGreen, 0, L, Offset=-40);
PlotShapes(IIf(Buy, shapeSquare, shapeNone),colorLime, 0,L, Offset=-50);
PlotShapes(IIf(Buy, shapeUpArrow, shapeNone),colorWhite, 0,L, Offset=-45);
PlotShapes(IIf(Sell, shapeSquare, shapeNone),colorRed, 0, H, Offset=40);
PlotShapes(IIf(Sell, shapeSquare, shapeNone),colorOrange, 0,H, Offset=50);
PlotShapes(IIf(Sell, shapeDownArrow, shapeNone),colorWhite, 0,H, Offset=-45);
///////////////////////
// Trend Score Count //
///////////////////////
_SECTION_BEGIN("Trend Score Count");
	TrendScore		=	IIf(V>Vp2,3,0) +
						IIf(V>Vp1,2,0) +
						IIf(V>VRG,1,0) +
						IIf(rg>(arg*2),2,0) +
						IIf(rg>arg,1,0) +
						IIf(rising,1,0) +
						IIf(bullishsign,3,0) +
						IIf(upThrustBar,2,0) +
						IIf(absorption,1,0) +
						IIf(EMAsBuy,1,0) +
						IIf(EMAmBuy,1,0) +
						IIf(EMAlBuy,1,0) +
						IIf(EMA_rc,3,0) +
						IIf(EMA_ac,2,0) +
						IIf(EMA_bl,1,0) +
						IIf(I_buy,2,0) +
						IIf(I_bull,1,0) +
						IIf(T3_buy,1,0) +
						IIf(BB1,1,0) +
						IIf(MACDBull,1,0) +
						//IIf(Aroon,1,0) +
						IIf(CK_upt,2,0) +
						IIf(CK_ups,1,0) +
						IIf(StochKBull,1,0) +
						IIf(RSItOs,1,0) +
						IIf(ARSIOs,1,0) +
						//IIf(R1,1,0) +
						IIf(M2,1,0) +
						IIf(ADX_Buy,2,0);
						IIf(ADX_bull,1,0);
						//IIf(ADXst,1,0);
	ScoreRank		=	100 * TrendScore / 30;
_SECTION_END();
if(Explorer==0)
{
//////////////////////
// Exploration Code //
//////////////////////
_SECTION_BEGIN("Explorer");
// PARAMETERS
	EXPfil_Parm	=	ParamList	( "Filter","All Symbols|Buy Signals|Sell Signals",0);
	EXPvol_Parm	=	Param		( "20 Day Min. Vol. Cap.", 50000,0,100000000,1000);
	EXPvol_Parm	=	Param		( "Min. Price Close",15,0,5000000,1);
// FILTER
Filter = 1;
// DISPLAY COLUMNS
	//AddColumn	(High52,"52 Week High");
	//AddColumn	(Low52,"52 Week Low");
	AddColumn		(C,"P.Close",1.2,IIf(C>Ref(C,-1),		colorGreen,colorRed));
	AddColumn		(V,"Volume",1,IIf(V>Ref(V,-1),			colorGreen,colorRed));
	AddTextColumn	(VPAv_Status,"VPA Volume",1,			VPAv_Color,BColor_vpa);
	AddTextColumn	(VPAs_Status,"VPA Spread",1,			VPAs_Color,BColor_vpa);
	AddTextColumn	(VPAc_Status,"VPA Close",1,				VPAc_Color,BColor_vpa);
	AddTextColumn	(VPAz_Status,"VPA Zone",1,				VPAz_Color,BColor_vpa);
	AddTextColumn	(VPAst_Status,"VPA Status",1,			VPAst_Color,BColor_vpa);
	AddTextColumn	(EMAs_Status,"EMA Short",1,				EMAs_Color,BColor_mas);
	AddTextColumn	(EMAm_Status,"EMA Mid",1,				EMAm_Color,BColor_mam);
	AddTextColumn	(EMAl_Status,"EMA Long",1,				EMAl_Color,BColor_mal);
	AddTextColumn	(EMAp_Status,"EMA Trend",1,				colorWhite,EMAp_Color);
	AddTextColumn (I_Status,"I Signal",1,					colorWhite,I_Color);
	AddTextColumn (T3_Status,"T3 Signal",1,				colorWhite,T3_Color);
	AddTextColumn	(BB_Status,"Bol. Band",1,				colorWhite,BB_Color);
	AddTextColumn	(MACD_Status,"MACD",1,					colorWhite,MACD_Color);
	AddTextColumn	(RSIt_Status,"MACD(RSI)",1,				colorWhite,RSIt_Color);
	//AddTextColumn	(AROON_Status,"Aroon",1,			colorWhite,AROON_Color);
	//AddTextColumn	(WAD_Status,"Williams A/D",1,		colorWhite,WAD_Color);
	AddTextColumn (COPPOCK_Status,"Coppock",1,			colorWhite,COPPOCK_Color);
	AddTextColumn	(STOCH_Status,"Stochastic",1,			colorWhite,STOCH_Color);
	AddTextColumn	(ARSI_Status,"ARSI",1,					colorWhite,ARSI_Color);
	//AddTextColumn	(RSI_Status,"RSI",1,					colorWhite,RSI_Color);
	AddTextColumn	(MFI_Status,"MFI(14)",1,				colorWhite,MFI_Color);
	AddTextColumn	(ADX_Status,"DMX (ADX)",1,				colorWhite,ADX_Color);
	//AddTextColumn	(ADXc_Status,"ADX Confirm",1,		colorWhite,ADXc_Color);
	//AddColumn		(RSIt,"TEST L",1,						colorWhite,colorBlack);
	AddColumn		(TtD_Change,"P/L %",1.2,IIf(TtD_Change>0,	colorGreen,colorRed));
	AddColumn		(Beta,"( ß )",1.2,IIf(Beta>0,colorGreen,colorRed));
	AddColumn		(ScoreRank,"% Rank",1.0,colorWhite,colorBlue);
_SECTION_END();
}
else
{

AlertIf( Buy, "", "BUY @ " + C, 1 );
AlertIf( Sell, "", "SELL @ " + C, 2 );
no=Param( "Swing", 8, 1, 55 );
tsl_col=ParamColor( "Color", colorLightGrey );
res=HHV(H,no);
sup=LLV(L,no);
avd=IIf(C>Ref(res,-1),1,IIf(C<Ref(sup,-1),-1,0));
avn=ValueWhen(avd!=0,avd,1);
tsl=IIf(avn==1,sup,res);

//no =  Optimize("TSL",Param("A (Change To Optimise)",10, 1, 55 ,1),1, 55 ,1);

tsl_col=ParamColor( "Color", colorLightGrey );
res=HHV(H,no);
sup=LLV(L,no);
avd=IIf(C>Ref(res,-1),1,IIf(C<Ref(sup,-1),-1,0));
avn=ValueWhen(avd!=0,avd,1);
dtsl=IIf(avn==1,sup,res);
SellPrice=ValueWhen(Short,C,1);
BuyPrice=ValueWhen(Buy,C,1);
Long=Flip(Buy,Sell);
Shrt=Flip(Short,Cover);
Relax = NOT Long AND NOT Buy AND NOT shrt AND NOT Sell AND NOT Sell AND NOT Cover;
SellSL=ValueWhen(Short,DTSL,1);
BuySL=ValueWhen(Buy,DTSL,1);
BuyDifference= BuyPrice - BuySL;
SellDifference = SellSL - SellPrice;

tar1 = IIf(Buy OR Long AND NOT Relax AND NOT Sell AND NOT Cover, (BuyPrice + BuyDifference), (SellPrice - SellDifference));
tar2 = IIf(Buy OR Long AND NOT Relax AND NOT Sell AND NOT Cover, (BuyPrice + (2*BuyDifference)), (SellPrice - (2*SellDifference)));
tar3 = IIf(Buy OR Long AND NOT Relax AND NOT Sell AND NOT Cover, (BuyPrice + (4*BuyDifference)), (SellPrice - (4*SellDifference)));
// User-defined parameter for EMA periods

EMA_Type		= Param("EMA-1, TEMA-2, JMA-3", 2, 1, 3, 1);
EMA_prds 		= Param("EMA_periods", 7, 1, 30, 1);
Std_MACD		= Param("Standard MACD? No-0, Yes-1", 1, 0, 1, 1);
Plot_fashion	= Param("Bar+Arrows-1, Impulse  Bars-2", 2, 1, 2, 1);


// Allow user to define Weekly and Monthly Ribbon Location and Height
WR_P1 = Param("Weekly Ribbon Location", -10.5, -1000, 1000, 0.1);
WR_P2 = Param("Weekly Ribbon Height", 366.5, -0.001, 500, 0.1);

MR_P1 = Param("Monthly Ribbon Location", 5.2, -1000, 1000, 0.1);
MR_P2 = Param("Monthly Ribbon Height", 199, -0.001, 500, 0.1);


// Compute EMA and MACD Histogram
if(EMA_Type == 1)
{
	DayEMA	= EMA(Close, EMA_prds);
}
if (EMA_Type == 2)
{
	DayEMA	= TEMA(Close, EMA_prds);
}

if(EMA_Type == 3)
{
	// Line below to be used with Jurik JMA
	// DayEMA = JurikJMA(C, EMA_Prds);
}

Histogram	= MACD() - Signal();

// Determine if we have an Impulse UP, DOWN or None
Impulse_Up		=	DayEMA > Ref(DayEMA, -1) AND Histogram > Ref(Histogram, -1);
Impulse_Down	=	DayEMA < Ref(DayEMA, -1) AND Histogram < Ref(Histogram, -1);
Impulse_None		=	(NOT Impulse_UP) AND (NOT Impulse_Down);

// Compute Weekly MACD and determine whether rising or falling
// Note: uses "non-standard"  parameters!
TimeFrameSet(inWeekly);

if (Std_MACD == 0)
{
MACD_val		=	MACD(5, 8);
Signal_val		=	Signal(5, 8, 5);
}
else
{
MACD_val		=	MACD(12, 26);
Signal_val		=	Signal(12, 26, 9);
}

Hist_in_w		=	MACD_val - Signal_val;

wh_rising = Hist_in_w > Ref(Hist_in_w, -1);
wh_falling = Hist_in_w < Ref(Hist_in_w, -1);

TimeFrameRestore();

// Now get Monthly MACD Histogram....
TimeFrameSet(inMonthly);
MACD_val		=	MACD(5, 8);
Signal_val		=	Signal(5, 8, 5);
Hist_in_m		=	MACD_val - Signal_val;

mh_rising = Hist_in_m > Ref(Hist_in_m, -1);
mh_falling = Hist_in_m < Ref(Hist_in_m, -1);

TimeFrameRestore();

wh_rising 		= TimeFrameExpand( wh_rising, inWeekly, expandLast );
wh_falling 		= TimeFrameExpand( wh_falling, inWeekly, expandLast);
mh_rising 	= TimeFrameExpand(mh_rising, inMonthly, expandLast);
mh_falling 	= TimeFrameExpand(mh_falling, inMonthly, expandLast);

kol 	= IIf( wh_rising, colorGreen,  IIf(wh_falling, colorRed,
colorLightGrey));
mkol 	= IIf( mh_rising, colorBlue,  IIf(mh_falling, colorYellow,
colorLightGrey));

// Plot them all!
if (Plot_fashion == 1)
{
	Plot(Close, "Close", colorTeal, styleBar);
	PlotShapes(shapeUpArrow * Impulse_Up, colorBlue, 0, Low, -12);
	PlotShapes(shapeDownArrow * Impulse_Down, colorRed, 0, High, -12);
	PlotShapes(shapeSmallCircle * Impulse_None, colorWhite, 0, High, 5);
}
else
{
	bar_kol	=	IIf(impulse_UP, colorBlue, IIf(impulse_Down, colorRed,
colorWhite));
	//Plot(C, "Close", bar_kol, styleBar);
}

Plot(10, "ribbon", kol, styleOwnScale|styleArea|styleNoLabel, WR_P1, WR_P2);//Weekly trend

Plot(10, "ribbon", mkol, styleOwnScale|styleArea|styleNoLabel, MR_P1,
MR_P2);	// Monthly Trend

// Explorer Section
// Determine if Impulse status is bullish, neutral or bearish.  Display as Text Column.

Impulse_State		=	WriteIf(Impulse_Up, "Bul", WriteIf(Impulse_Down,
"Bear", "Neut"));

// Set the background color for Impulse Status Column
Impulse_Col		=	IIf(Impulse_Up, colorGreen, IIf(Impulse_Down, colorRed,
colorLightGrey));

// Determine Weekly Trend. Display as Text Column
Weekly_Trend		=	WriteIf(wh_rising, "Rising", WriteIf(wh_falling, "Falling",
"Flat!"));
Weekly_Col		=	IIf(wh_rising, colorGreen, IIf(wh_falling, colorRed,
colorLightGrey));

// Determine Monthly Trend. Display as Text Column
Monthly_Trend	=	WriteIf(mh_rising, "Rising", WriteIf(mh_falling, "Falling",
"Flat!"));
Monthly_Col		=	IIf(mh_rising, colorGreen, IIf(mh_falling, colorRed,
colorLightGrey));

// Determine how many bars has the current state existed
bars_in_bull	=	Min(BarsSince(impulse_none), BarsSince(impulse_down));
bars_in_bear	=	Min(BarsSince(impulse_up), BarsSince(impulse_none));
bars_in_neut	=	Min(BarsSince(impulse_down), BarsSince(impulse_up));

// Set a single variable to show number of bars in current state depending upon

// actual Impulse Status - Bullish, Bearish or Neutral
bars_in_state	=	IIf(Impulse_Up,bars_in_bull, IIf(Impulse_down, bars_in_bear,bars_in_neut));
//AddColumn(Close,"Close",1.2);
// Columns for display in Explorer
//AddTextColumn(Impulse_State, "Status", 1, colorWhite, Impulse_Col);
//AddColumn(bars_in_state, "Bars", 1, colorWhite, Impulse_col);
//Action = WriteIf(Buy, "BUY", WriteIf(Sell, "SELL", "   "));
//i=0;
//bars_in_statee	=	IIf(Buy, BarCount[i], IIf(Sell, BarCount[i],bars_in_neut));
//bars=BarsSince(IIf(Buy+BarCount+1),OR( Sell-BarCount+1));

AddColumn(bars_in_state ,"Bars", 1, colorWhite, Impulse_col);
//AddTextColumn(Weekly_Trend, "W Trend", 1, colorWhite, Weekly_Col);
//AddTextColumn(Monthly_Trend, "M Trend", 1, colorWhite, Monthly_Col);

//Filter = 1;

_SECTION_END();
//Settings for exploration

H1 = SelectedValue( TimeFrameGetPrice( "H", inDaily, -1 ) );
L1 = SelectedValue( TimeFrameGetPrice( "L", inDaily, -1 ) );
C1 = SelectedValue( TimeFrameGetPrice( "C", inDaily, -1 ) );
H2 = SelectedValue( TimeFrameGetPrice( "H", inDaily, 0 ) );
L2 = SelectedValue( TimeFrameGetPrice( "L", inDaily, 0 ) );
O1 = SelectedValue( TimeFrameGetPrice( "open", inDaily, 0 ) );
F4 = 0;
D1 = ( H1 - L1 );
D2 = ( H2 - L2 );
F1 = D1 * 0.433;
F2 = D1 * 0.766;
F3 = D1 * 1.35;
if ( D2 <= F1 )
    F4 = F1;
else
    if ( D2 <= F2  )
        F4 = F2;
    else
        F4 = F3;

S_P = ( O1 - F4 );

B_P = ( O1 + F4 );

BP = ( L2 + F4 );

BPTGT = ( BP + ( BP * .0065 ) );//.0015 brokerage

BPSTPLS = ( BP - ( BP * .0085 ) );

SP = ( H2 - F4 );

SPTGT = ( SP - ( SP * .0065 ) );

SPSTPLS = ( SP + ( SP * .0085 ) );


p = ( H1 + L1 + C1 ) / 3;

s1 = ( H1 );

r1 = ( L1 );

r2 = SelectedValue( L2 );

s2 = SelectedValue( H2 );

//CONDITION

if (ParamToggle("Tooltip shows", "All Values|Only Prices"))
{
  ToolTip = StrFormat("Open: %g\nHigh:  %g\nLow:   %g\nClose:  %g (%.1f%%) \nVolume: " + NumToStr(V, 1), O, H, L, C, SelectedValue(ROC(C, 1)));
}

//space = Param("Space on Chart", 20,  - 15, 50, 1);
//GraphXSpace = space;
//SetChartBkColor(ParamColor("Background Color", colorBlack));

// ================= Rasheed's original code (with Lookback and Shift default set to his specs) =================

H0 = H;
L0 = L;
C0 = C;
O0 = O;

Lookback = Param("LookBack", 10, 10, 50, 1); // Default for interday commodity currency trading
shift = Param("Shift", 5, 1, 50, 1); // ?
x0 = LastValue(Cum(1));
x1 = x0 - shift;
H = Ref(H,  - shift + 1);
L = Ref(L,  - shift + 1);
H1 = LastValue(Ref(HHV(H, Lookback),  - 1));
L1 = LastValue(Ref(LLV(L, Lookback),  - 1));

Plot(H1, "H1", colorYellow);
Plot(L1, "L1", colorYellow);

H = H0;
L = L0;
C = C0;
O = O0;

up = Cross(H, H1)AND Cum(1) > x1;
dn = Cross(L1, L)AND Cum(1) > x1;

//Plot(C, "Close", IIf(Cum(1) > x1 - Lookback AND Cum(1) <= x1, colorBlue, IIf(Up, colorBrightGreen, IIf(Dn, colorRed, IIf(C > O, colorGreen, colorRed)))), 64);
//PlotShapes(shapeDownArrow *(Cum(1) == x1 + 1), colorBlue);

// ======================= Exploration and Signal Code =================
TRIGGER = ParamToggle("Trigger ", "CLOSE|HIGH OR LOW");


XH1 = Cross(C, H1);
XL1 = Cross(L1, C);
XH2 = Cross(H, H1);
XL2 = Cross(L1, L);

if (TRIGGER == 0)
{
  //Buy = XH1;
  //Sell = XL1;
}

else
{
  //Buy = XH2;
  //Sell = XL2;
}


TradeDisplay = ParamToggle("Remove Extra Trades?", "No|Yes");

if(TradeDisplay != 0){
	//Buy = ExRem(Buy, Sell);
  	//Sell = ExRem(Sell, Buy); // THIS WILL REMOVE EXESS SIGNALS ON A CHART OR IN AN EXPLORATION
}

Filter = Buy OR Sell;
Action = WriteIf(Buy, "BUY", WriteIf(Sell, "SELL", "   "));

//AddTextColumn(IndustryID(1), "Industry Sector  ", 30.0, colorBlue, colorYellow);
AddColumn(C, "Last ", 2.2, colorWhite, colorBlue);
AddTextColumn(Action, "Action", 8.0, IIf(XH1, colorDarkGreen, colorDarkRed), colorWhite);
AddColumn(IIf(XH1, H1, L1), "BREAKOUT LEVEL", 3.2, colorYellow, IIf(XH1, colorDarkGreen, colorDarkRed));

// -----------------------------------------------------------------------------------  Arrow signals --- FOR TRADES  ----------------------------------------------------------
//PlotShapes(Buy *shapeUpArrow, colorBrightGreen, 0, L /* ENTRY_TRAILARRAY */,  - 30);
//PlotShapes(Sell *shapeDownArrow, colorLightYellow, 0, H,  - 30);
_SECTION_END();


_SECTION_BEGIN("Volume At Price");
PlotVAPOverlay(Param("Lines", 1000, 100, 1000, 10), Param("Width", 15, 1, 100, 1), ParamColor("Color", colorBlue), ParamToggle("Side", "Left|Right", 1) | 4 *ParamToggle("Z-order", "On top|Behind", 1));

_SECTION_END();
//Filter =  Buy OR Sell;

//AddColumn( IIf( Buy, 66, 1 ), "Buy", formatChar, 1, bkcolor = IIf( Buy, 43, 33 ) );

//AddColumn( IIf( Sell, 83, 1 ), "Sell", formatChar, 1, bkcolor = IIf( Sell, 25, 32 ) );


//AddColumn( C, "CMP", 1.2, colorDefault, colorLightBlue );

//AddColumn( BP, "SELL PRICE", 1.2, colorDefault, colorGreen );

//AddColumn( BPTGT, "TGT PRICE", 1.2, colorDefault, colorBrown );

//AddColumn( BPSTPLS, "STPLS BUY", 1.2, colorDefault, colorRed );

AddColumn( p, "PIVOT", 1.2, colorDefault, colorYellow );

//AddColumn( SPSTPLS, "STPLS SELL", 1.2, colorDefault, colorRed );

//AddColumn( SP, "SELL PRICE", 1.2, colorDefault, colorGreen );

//AddColumn( SPTGT, "TGT PRICE", 1.2, colorDefault, colorBrown );


//Settings for exploration

Filter=Buy OR Short;
AddColumn( IIf( Buy, 66 , 83 ), "Signal", formatChar, colorDefault, IIf( Buy , colorGreen, colorRed ) );
AddColumn(Close,"Entry Price",1.4, colorDefault, IIf( Buy , colorGreen, colorRed ));
AddColumn(dtsl,"Stop Loss",1.4, colorDefault, IIf( Buy , colorGreen, colorRed ));
AddColumn(tar1,"Target 1",1.4, colorDefault, IIf( Buy , colorGreen, colorRed ));
AddColumn(tar2,"Target 2",1.4, colorDefault, IIf( Buy , colorGreen, colorRed ));
AddColumn(tar3,"Target 3",1.4, colorDefault, IIf( Buy , colorGreen, colorRed ));

AddColumn(ROC(V,1),"RVol ",1.2, IIf(ROC(V,1) > 0, colorGreen, colorRed));
AddColumn(Volume,"Volume",1.0, colorDefault, IIf ((Volume > 1.25 * EMA( Volume, 34 )),colorBlue,colorYellow));
AddColumn( H1, "PRE-HIGH" );

AddColumn( L1, "PRE-LOW" );

AddColumn( D1, "PRE-DIFF" );

AddColumn( F1, "0.433" );

AddColumn( F2, "0.766" );

AddColumn( F3, "1.35" );

AddColumn( H2, "D-HIGH" );

AddColumn( L2, "D-LOW" );

AddColumn( D2, "D-DIFF" );

AddColumn( F4, "SELECT FACT" );

AlertIf( Buy , "SOUND C:\\Windows\\Media\\chimes.wav", "Audio alert", 2 );
AlertIf( Sell , "SOUND C:\\Windows\\Media\\alert.wav", "Audio alert", 2 );
}

Short=Sell;
Cover=Buy;
Long=Flip(Buy,Sell);
Shrt=Flip(Short,Cover);
SellPrice=ValueWhen(Short,C,1);
BuyPrice=ValueWhen(Buy,C,1);
Edc=(
WriteIf (Buy AND Ref(shrt,-1), " BUY @ "+C+"  ","")+
WriteIf (Sell AND Ref(Long,-1), " SEll @ "+C+"  ","")+
WriteIf(Sell , "Last Trade Profit Rs."+(C-BuyPrice)+"","")+
WriteIf(Buy  , "Last Trade Profit Rs."+(SellPrice-C)+"",""));

//============== TITLE ==============


_SECTION_BEGIN("Tops and bottom");

pd = Param("Periods",13,5,144,1);
pds = 2*pd-1;//     (Adjustment for Wilders MA)
aa = Close-Ref(Close,-1);
uu = EMA(Max(0,aa),pds);
dd=  EMA((Max(0,0-aa)),pds);

rf = IIf(C>2,1000,10000);

c1 = Param("Upper Level",70,50,90,1);
qq1 =100/(100-c1)-1;
ff1 = qq1*dd-uu;
ff2 = ff1/qq1;
f1 = Max(ff1,ff2);
UL = Close + f1*(pds-1)/2;
UL = IIf(UL>C,floor(UL*rf),ceil(UL*rf))/rf;

c2 = Param("Equilibrium",50,50,50,0);
qq2 =100/(100-c2)-1;// [=1]
ff = dd-uu;
MM = Close + ff*(pds-1)/2;
MM = IIf(MM>C,floor(MM*rf),ceil(MM*rf))/rf;

c3 = Param("Lower Level",30,10,50,1);
qq3 =100/(100-c3)-1;
ff1 = qq3*dd-uu;
ff2 = ff1/qq3;
f3 = Min(ff1,ff2);
LL = Close + f3*(pds-1)/2;
LL = IIf(LL>C,floor(LL*rf),ceil(LL*rf))/rf;

band = Param("band width",4,0,15,0.25);
mmu = MM+band;
mmd = MM-band;

_SECTION_BEGIN("Pivot calc");

TimeFrameSet( in15Minute*2 );
DH=Ref(H,-1);
DL=Ref(L,-1);
DC=Ref(C,-1);


pd = ( DH+ DL + DC )/3;
sd1 = (2*pd)-DH;
sd2 = pd -(DH - DL);
sd3 = Sd1 - (DH-DL);
rd1 = (2*pd)-DL;
rd2 = pd +(DH -DL);
rd3 = rd1 +(DH-DL);

if(ChangeTitle==1)
{

_SECTION_BEGIN("Title");
no=Param( "Swing", 6, 1, 55 );
res=HHV(H,no);
sup=LLV(L,no);
avd=IIf(C>Ref(res,-1),1,IIf(C<Ref(sup,-1),-1,0));
avn=ValueWhen(avd!=0,avd,1);
tsl=IIf(avn==1,sup,res);
dec = (Param("Decimals",2,0,7,1)/10)+1;
if( Status("action") == actionIndicator )
(
Title = EncodeColor(55)+  Title = Name() + "     " + EncodeColor(32) + Date() +
"      " + EncodeColor(5) + "{{INTERVAL}}  " +
	EncodeColor(55)+ "     Open = "+ EncodeColor(52)+ WriteVal(O,dec) +
	EncodeColor(55)+ "     High = "+ EncodeColor(5) + WriteVal(H,dec) +
	EncodeColor(55)+ "      Low = "+ EncodeColor(32)+ WriteVal(L,dec) +
	EncodeColor(55)+ "    Close = "+ EncodeColor(52)+ WriteVal(C,dec)+
	EncodeColor(55)+ "    Volume = "+ EncodeColor(52)+ WriteVal (V ,1.25)


+"\n"+EncodeColor(colorBrightGreen)+

WriteIf (Buy , "Signal: Go Long - Entry Price: "+WriteVal(C)+" - Traget: "+WriteVal((BuyPrice-tsl)+BuyPrice)

+" - StopLoss:"+WriteVal(tsl)+"  "

,"")+

"\n"+EncodeColor(colorRed)+
WriteIf (Sell , "Signal: Go Short - Entry Price: "+WriteVal(C)+" - Target: "+WriteVal((tsl-SellPrice)-SellPrice)+" - StopLoss:"+WriteVal(tsl)+" ","")+
EncodeColor(colorTurquoise)+
WriteIf(Long AND NOT Buy, "Trade: Long - Entry Price: "+WriteVal((BuyPrice))+" - Profit: "+WriteVal((C-BuyPrice))+" "+EncodeColor(colorLime)+"Let your profit runs!","")+
EncodeColor(colorLightOrange)+
WriteIf(shrt AND NOT Sell, "Trade: Short - Entry Price: "+WriteVal((SellPrice))+" - Profit: "+WriteVal((C-SellPrice))+"  - "+EncodeColor(colorLime)+"Let your profit runs!","")+

EncodeColor(colorBrightGreen)+   "


\n R3 : "+
EncodeColor(colorWhite)+RD3+
EncodeColor(colorBrightGreen)+   "\n R2 : "+
EncodeColor(colorWhite)+RD2+
EncodeColor(colorBrightGreen)+   "\n R1 : " +
EncodeColor(colorWhite)+RD1 +
EncodeColor(colorBrightGreen)+  "     UP TGT   : "+
EncodeColor(colorWhite)+UL+
EncodeColor(colorBlue)+   "\n Pivot : "+
EncodeColor(colorWhite)+pd+
EncodeColor(colorBlue)+   "    MIDPOINT : "+
EncodeColor(colorWhite)+MM+
EncodeColor(colorRed)+   "\n S1 : "+
EncodeColor(colorWhite)+SD1   +
EncodeColor(colorRed)+    "     BOT TGT  : "+
EncodeColor(colorWhite)+LL+
EncodeColor(colorRed)+   "\n S2 : "+
EncodeColor(colorWhite)+SD2+
EncodeColor(colorRed)+   "\n S3 : "+
EncodeColor(colorWhite)+SD3
);
_SECTION_END();
}

if(Buyselllable==1)
{
dist = 1.5*ATR(10);
dista = 0.5*ATR(10);
for( i = 0; i < BarCount; i++ )
{

if( Buy[i] ) PlotText( "Buy  \n"+C[i] , i, L[ i ]-dist[i], colorBlack,colorGreen );
if( Sell[i] ) PlotText( "Sell \n"+C[i], i, H[ i ]+dist[i], colorBlack, colorRed );
//if( Buy[i] ) PlotText( "B" , i, L[ i ]-dist[i], colorBlack,colorGreen );
//if( Sell[i] ) PlotText( "S" , i, H[ i ]+dist[i], colorBlack, colorRed );
if( Sell[i] ) PlotText( "Top" , i, H[ i ]+dista[i], colorGreen, colorBlack );
if( Buy[i] ) PlotText( "Bottom", i, L[ i ]-dista[i], colorRed, colorBlack );


}  }
5 comments
Leave Comment
Please login here to leave a comment.
Back
error 718 x1=IIf(Cloc=0,arg,x);
and then, too,
Dear Sir
Please mail AFL formula to my mail ID: bchandra1981@gmail.com , Thanks in advance
error
Interesting Exploration. However I would like to change “Filter” to:
Filter = C <60 AND C >2 AND Volume > 80000 AND C> Ref(C,-1);
I tried to do but it didn’t work. Let know how to accomplish as my target isn’t extremely high price stocks.
Thanks
Dick Hoierman
Giving Error in Line no 718.
x1=IIf(Cloc=0,arg,x);
Warning 501. Assignment within Conditional. Did you mean == instead of =?
How to solve ?
Thanks in advance.
Raja