Stock Portfolio Organizer
The ultimate porfolio management solution.
WiseTrader Toolbox
#1 Selling Amibroker Plugin featuring:
Sum of Risks for Amibroker (AFL)
I cannot take credit for this indicator, and I can no longer find the name of the creator.
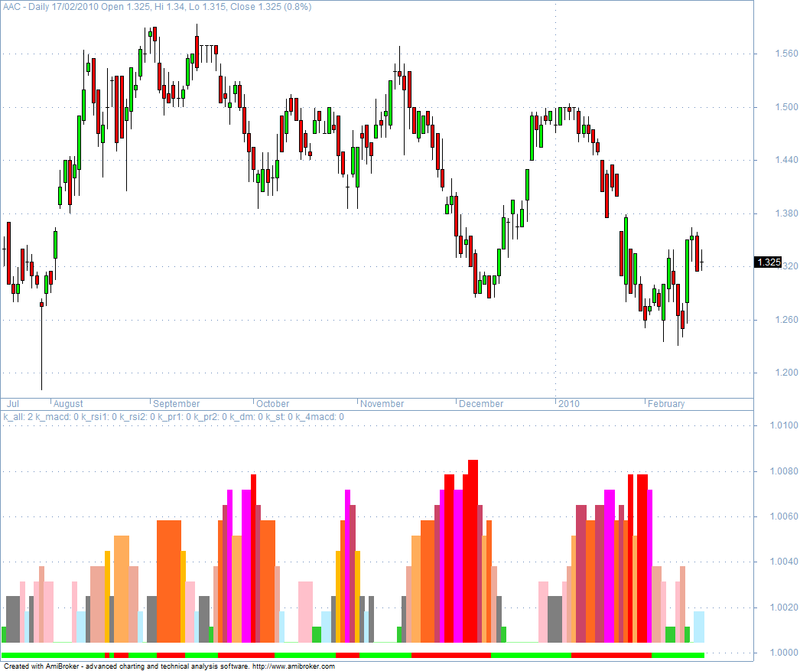
This indicator is based on multiple indicators. It creates a ribbon at the bottom of the chart below the histogram bars.
Towards the end of the code, the line, "Plot(K, “ribbon”, Color, styleOwnScale|styleArea|styleNoLabel, -1,15);" can be blanked out using “//” at the beginning of that line to hide the histogram bars. This will leave only the ribbon which can be plotted on a price chart or in any other indicator pane.
The very last line of code can be changed as follows:
Plot(1, “ribbon2”, Color2, styleOwnScale|styleArea|styleNoLabel, -.15, 1);
By doing this, it creates a ribbon that will fill the entire pane. You can then plot any indicator on top of it.
Screenshots
Similar Indicators / Formulas
1 comments
Leave Comment
Please login here to leave a comment.
Back
thanks for this useful afl sir