Stock Portfolio Organizer
The ultimate porfolio management solution.
Shares, Margin, CFD's, Futures and Forex
EOD and Realtime
Dividends and Trust Distributions
And Much More ....
WiseTrader Toolbox
#1 Selling Amibroker Plugin featuring:
Advanced Adaptive Indicators
Advanced Pattern Exploration
Neural Networks
And Much More ....
Heinkein Ashi ATR System for Amibroker (AFL)
Rating:
3 / 5 (Votes 6)
Tags:
trading system, amibroker
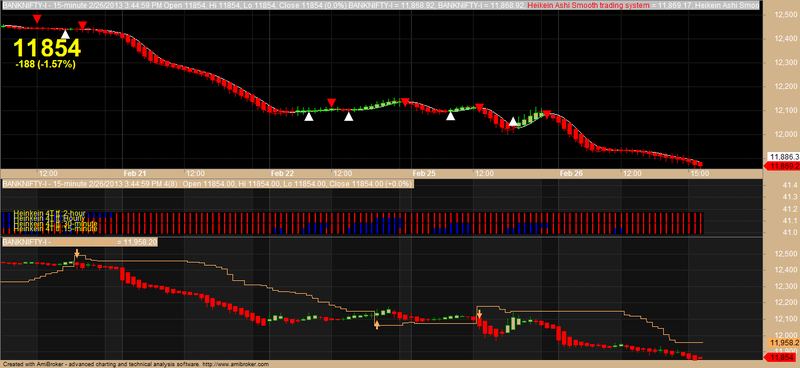
This is Heinkein Ashi with ATR added to it.
It is very much useful in 5 min chart when prices are in oversold or overbought Zones.
Buying should be done, once 1 candle close is above ATR or Stoploss line (Buy above High of the candle)-5 min timeframe.
Selling should be done, once 1 candle close is below ATR or Stoploss line (Sell below Low of candle)- 5 Min timeframe
Regards
Screenshots
Similar Indicators / Formulas
EMA crossover
Submitted
by Ketan-0 about 13 years ago
Kase Peak Osc. V2 batu
Submitted
by batu1453 almost 10 years ago
Kase CD V2batu
Submitted
by batu1453 almost 10 years ago
Ichimoku
Submitted
by prashantrdx almost 10 years ago
buy and sell two EMAS
Submitted
by mundo0007 about 12 years ago
Adaptive Price Zone (APZ)
Submitted
by AndrewThomas about 13 years ago
Indicator / Formula
Copy & Paste Friendly
HaClose = (O+H+L+C)/4;
HaOpen = AMA( Ref( HaClose, -1 ), .40);
HaHigh = Max( H, Max( HaClose, HaOpen ) );
HaLow = Min( L, Min( HaClose, HaOpen ) );
xDiff = (HaHigh - Halow) * IIf(StrFind(Name(),"JPY"),100,10000);
barcolor = IIf(HaClose >= HaOpen,colorGreen,colorRed);
PlotOHLC( HaOpen, HaHigh, HaLow, HaClose, "", barcolor, styleCandle );
// Plot(EMA(HaClose,9),"",colorWhite, styleLine);
// Plot(EMA(HaClose,18),"",colorBlack, styleLine);
_SECTION_BEGIN("Heikin Ashi-20");
//Save indicator as "Heikin Ashi-20.afl" in C: program files > Amibroker > Formulas > Custom folder and then drap and drop on price chart
no=Param( "Swing", 20, 1, 55 );
tsl_col=ParamColor( "Color", colorCycle );

res=HHV(H,no);
sup=LLV(L,no);
avd=IIf(C>Ref(res,-1),1,IIf(C<Ref(sup,-1),-1,0));
avn=ValueWhen(avd!=0,avd,1);
tsl=IIf(avn==1,sup,res);

Plot(tsl, _DEFAULT_NAME(), tsl_col, styleStaircase); // or styleaArea

Buy=Cross(C,tsl);
Sell=Cross(tsl,C);
shape=Buy*shapeUpArrow + Sell*shapeDownArrow;
PlotShapes(shape,IIf(Buy,tsl_col,tsl_col),0,IIf(Buy,Low,High));
_SECTION_END();
0 comments
Leave Comment
Please login here to leave a comment.
Back