Stock Portfolio Organizer
The ultimate porfolio management solution.
Shares, Margin, CFD's, Futures and Forex
EOD and Realtime
Dividends and Trust Distributions
And Much More ....
WiseTrader Toolbox
#1 Selling Amibroker Plugin featuring:
Advanced Adaptive Indicators
Advanced Pattern Exploration
Neural Networks
And Much More ....
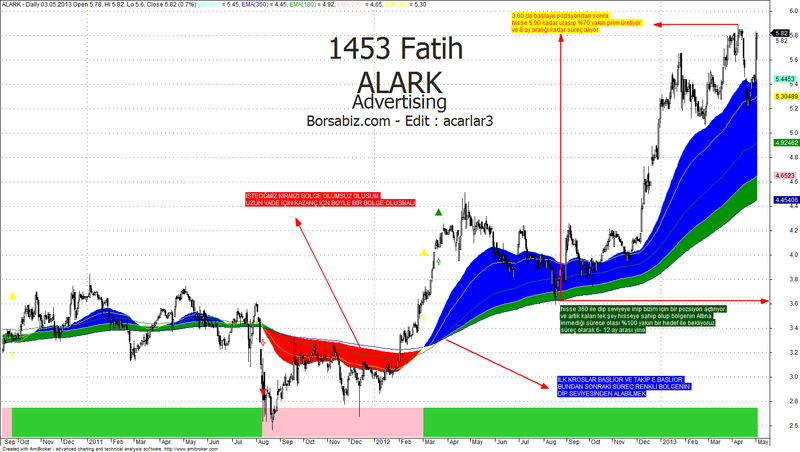
1453 Fatih for Amibroker (AFL)
Rating:
3 / 5 (Votes 8)
Tags:
trading system, amibroker, moving average
System that gives huge profits. Golden Cross
Screenshots
Similar Indicators / Formulas
Positional trading
Submitted
by technotrader almost 10 years ago
Guppy MMA Convergence Divergence Histogram
Submitted
by walid over 13 years ago
Debdulal And Soumya
Submitted
by siivaramm over 13 years ago
Moving Average Difference
Submitted
by rananjay00007 about 14 years ago
Super TEMA
Submitted
by HARI123 over 13 years ago
The Quest For Reliable Crossovers
Submitted
by Gorilabd over 13 years ago
Indicator / Formula
Copy & Paste Friendly
_SECTION_BEGIN("BACK COLR");

GfxSetOverlayMode(1);

GfxSetOverlayMode(1);
GfxSelectFont("Tahoma", Status("pxheight")/20 ); /* Up down name*/
GfxSetTextAlign( 6 );// center alignment
GfxSetTextColor( ParamColor("Text Color", ColorHSB( 42, 42, 42 ) ));
GfxSetBkMode(0); // transparent
GfxTextOut( Name(), Status("pxwidth")/2, Status("pxheight")/7);
GfxSelectFont("Tahoma", Status("pxheight")/30 );
GfxTextOut( IndustryID(1), Status("pxwidth")/2, Status("pxheight")/5 );  /* Up Down Sector*/

GfxSelectFont("Tahoma", Status("pxheight")/40 );
GfxTextOut( "Borsabiz.com - Edit : acarlar3", Status("pxwidth")/2, Status("pxheight")/4);
GfxSelectFont("Tahoma", Status("pxheight")/20 );
GfxTextOut( "1453 Fatih - Borsabiz.com", Status("pxwidth")/2, Status("pxheight")/15 );

_SECTION_BEGIN("Price");
SetChartOptions(0,chartShowArrows|chartShowDates);
_N(Title = StrFormat("{{NAME}} - {{INTERVAL}} {{DATE}} Open %g, Hi %g, Lo %g, Close %g (%.1f%%) {{VALUES}}", O, H, L, C, SelectedValue( ROC(C, 1 ) ) ));
Plot( C, "Close", ParamColor("Color", colorBlack ), styleNoTitle | ParamStyle("Style") | GetPriceStyle() );
_SECTION_END();


_SECTION_BEGIN("EMA");


P = ParamField("Price field",-1);
Periods1 = Param("Periods1", 60, 2, 500, 1, 10 );
Periods2 = Param("Periods2", 360, 2, 500, 1, 10 );
Periods3 = Param("Periods3", 180, 2, 500, 1, 10 );
Periods4 = Param("Periods4", 270, 2, 500, 1, 10 );
Periods5 = Param("Periods5", 90, 2, 500, 1, 10 );
Plot( EMA( P, Periods1 ), StrFormat(_SECTION_NAME()+"(%g)", Periods1), ParamColor( "Color1", colorAqua ), ParamStyle("Style") );
Plot( EMA( P, Periods2 ), StrFormat(_SECTION_NAME()+"(%g)", Periods2), ParamColor( "Color2", colorDarkBlue ), ParamStyle("Style") );
Plot( EMA( P, Periods3 ), StrFormat(_SECTION_NAME()+"(%g)", Periods3), ParamColor( "Color3", colorGreen ), ParamStyle("Style") );
Plot( EMA( P, Periods4 ), StrFormat(_SECTION_NAME()+"(%g)", Periods4), ParamColor( "Color4", colorPink ), ParamStyle("Style") );
Plot( EMA( P, Periods5 ), StrFormat(_SECTION_NAME()+"(%g)", Periods5), ParamColor( "Color5", colorYellow ), ParamStyle("Style") );
Buy = Cross( EMA( P, Periods4 ), EMA( P, Periods2 ) );
Sell = Cross(EMA( P,Periods2 ),  EMA( P, Periods1 ) );
izleme= Cross(EMA( P,Periods1 ),  EMA( P, Periods2 ) );


PlotShapes(IIf(Buy==1, shapeHollowUpArrow , shapeNone), colorGreen, 0,Low, Offset=-30);
PlotShapes(IIf(Sell==1, shapeHollowDownArrow, shapeNone), colorRed, 0,High, Offset=-30);
PlotShapes(IIf(izleme==1, shapeHollowUpArrow, shapeNone), colorBlue, 0,Low, Offset=-30);

COLOR=IIf(Buy,colorLime,IIf(Sell,colorRed,colorWhite));
Plot(C,"",COLOR,styleCandle|styleThick);
PlotShapes( IIf( Buy, shapeUpTriangle, shapeNone ), colorGreen, layer = 0,yposition = L, offset = 70);
PlotShapes( IIf( Sell, shapeDownTriangle, shapeNone ), colorRed, layer = 0, yposition =H, offset = 70);
PlotShapes( IIf( izleme, shapeUpTriangle, shapeNone ), colorYellow, layer = 0, yposition =H, offset = 80);

PlotOHLC( Null,EMA( P, Periods4 ),EMA( P, Periods2 ),Null, "", IIf(EMA( P, Periods4 )>EMA( P, Periods2 ) ,colorGreen,colorWhite), styleCloud);
PlotOHLC( Null,EMA( P, Periods2 ),EMA( P, Periods1 ),Null, "", IIf(EMA( P, Periods2 )<EMA( P, Periods1 ) ,colorBlue,colorRed), styleCloud);


Color = IIf( EMA(p,periods1) > EMA(p,periods2) , colorLime, IIf( EMA(p,periods2) > EMA(p,periods1), colorPink, colorGrey40 ));
Plot( 2, "", Color, styleArea | styleOwnScale | styleNoLabel, -0.1, 30 );

_SECTION_END();
7 comments
Leave Comment
Please login here to leave a comment.
Back
VERY NICE INDICATOR FOR POSITIONAL TRADING———THANKS FOR POSTING
how do i use the indicators
Bravo kardesime.Bes yildizida koyuyum hindulara ders olsun.
Thanks for your sharing this successfull indicator.
merhabalar
1453 sisteminin mantıgı Büyük Trend yakalamaktır
kullanım şekli ise kırmızı bolgeden mavi-yeşil bolge oluşunca hissenin düşüşü beklenilir
düşüş mavi-yeşil bolgeye girince 1 yıllık bir trade açılır
alacaginiz dip seviye yeşil veya yeşile yakın olmalı dir 180-360 arası
burdan itibaren hissenin hedefi %100 kar dır
google translate çevirisi :
Hi
Big Trend in 1453 to catch the logic of the system
How to use the red-blue-green territory in the region occurs EXPECT shares fall
blue-green region entered a 1-year decline in trade opens
right law, must be close to the bottom level is green or green, from 180 to 360
the goal is 100% profit share from here
google translate translation:
borsabizcom teşekkürler
teşekkürler
ersin kardeşinden sevgilerle. 5 yıldızlık bir performans