Stock Portfolio Organizer
The ultimate porfolio management solution.
Shares, Margin, CFD's, Futures and Forex
EOD and Realtime
Dividends and Trust Distributions
And Much More ....
WiseTrader Toolbox
#1 Selling Amibroker Plugin featuring:
Advanced Adaptive Indicators
Advanced Pattern Exploration
Neural Networks
And Much More ....
KD High Low Indicator for Amibroker (AFL)
Rating:
3 / 5 (Votes 2)
Tags:
amibroker
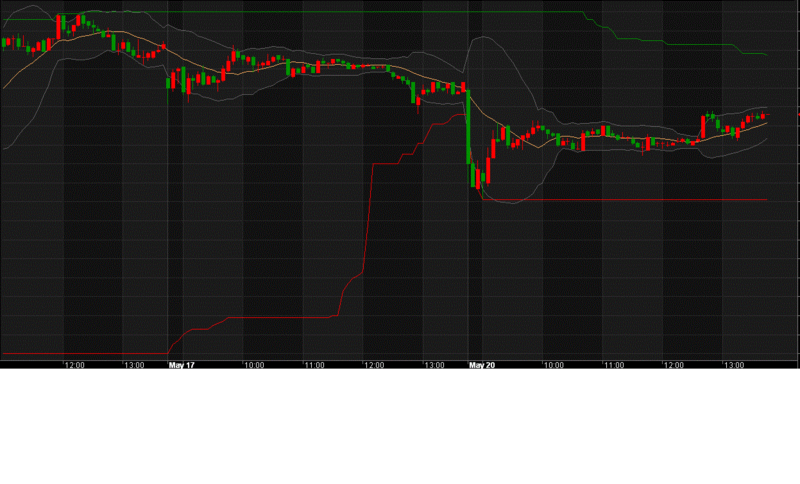
A rising curve _High
A decline curve _Low
When the value of K> 80, the rising curve of _High start recording a new high-priced
When K <20, the decline curve _Low start recording a new low
Screenshots
Similar Indicators / Formulas
Kavach Of Karna v2
Submitted
by hbkwarez almost 10 years ago
Advanced Elliott Waves
Submitted
by MarcosEn over 12 years ago
3_6Day GuaiLiLv
Submitted
by motorfly over 12 years ago
Williams Alligator System
Submitted
by durgesh1712 over 12 years ago
*Level Breakout system*
Submitted
by Tinych over 12 years ago
Horizontal Live Priceline Tool
Submitted
by northstar over 12 years ago
Indicator / Formula
Copy & Paste Friendly
Area = 100;
periods = Param( "Periods", 15, 1, 200, 1 );
Ksmooth = Param( "%K avg", 3, 1, 200, 1 );
K=StochK( periods , Ksmooth);


function pHigh( Area )
{
	HHVtemp = HHV( High, Area);
	result = HHVTemp;
		return result;
}

function pLow( Area )
{
	LLVtemp = LLV( Low, Area );
	result = LLVtemp;
	return result;
}

function NewpHigh( Area )
{
     ph = pHigh(  Area  );
         ph =  IIf(  K  >  80 , pHigh(  Area  ),  Ref( Nz( ph ), -1 ));
  return ph;
}

function NewpLow( Area )
{
    pl = pLow(  Area  );


    pl = IIf(  K  <  20 , pLow(  Area  ),  Ref( Nz( pl ), -1 ));


  return pl;
}

showPL=NewpLow( 100 );
showPH=NewpHigh( 100 );

Plot( showPL, "DL", colorRed );
Plot( showPH, "DH", colorGreen );
0 comments
Leave Comment
Please login here to leave a comment.
Back