Stock Portfolio Organizer
The ultimate porfolio management solution.
Shares, Margin, CFD's, Futures and Forex
EOD and Realtime
Dividends and Trust Distributions
And Much More ....
WiseTrader Toolbox
#1 Selling Amibroker Plugin featuring:
Advanced Adaptive Indicators
Advanced Pattern Exploration
Neural Networks
And Much More ....
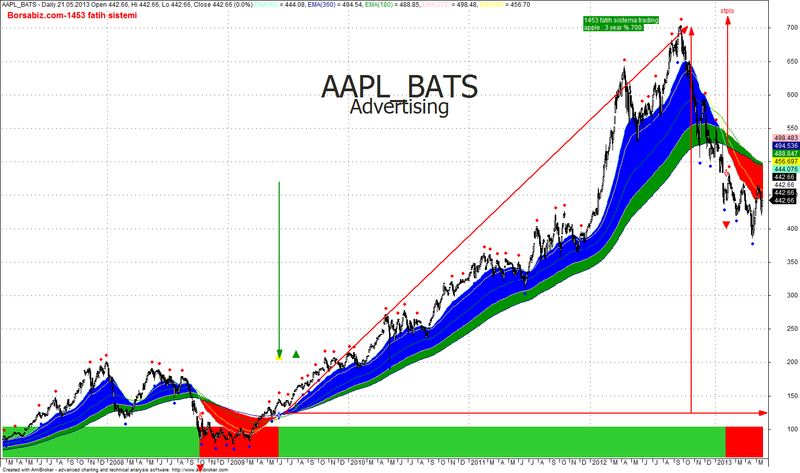
1453 fatih for Amibroker (AFL)
Rating:
3 / 5 (Votes 10)
Tags:
trading system, amibroker
System that gives huge profits. Golden Cross
Hi
Big Trend in 1453 to catch the logic of the system
How to use the red-blue-green territory in the region occurs EXPECT shares fall
blue-green region entered a 1-year decline in trade opens
right law, must be close to the bottom level is green or green, from 180 to 360
the goal is 100% profit share from here
Screenshots
Similar Indicators / Formulas
EMA crossover
Submitted
by Ketan-0 over 14 years ago
Kase Peak Osc. V2 batu
Submitted
by batu1453 almost 11 years ago
Kase CD V2batu
Submitted
by batu1453 almost 11 years ago
Ichimoku
Submitted
by prashantrdx about 11 years ago
buy and sell two EMAS
Submitted
by mundo0007 over 13 years ago
Adaptive Price Zone (APZ)
Submitted
by AndrewThomas over 14 years ago
Indicator / Formula
Copy & Paste Friendly
1 2 3 4 5 6 7 8 9 10 11 12 13 14 15 16 17 18 19 20 21 22 23 24 25 26 27 28 29 30 31 32 33 34 35 36 37 38 39 40 41 42 43 44 45 46 47 48 49 50 51 52 53 54 55 56 57 58 59 60 61 62 63 64 65 66 67 68 69 70 71 72 73 74 75 76 77 78 79 80 81 82 83 84 85 86 87 88 | /* 1453 Fatih Sistemi - acarlar33borsabiz.com facebook.com/acarlar33 Borsabiz.com tarafindan acarlar33 tarafindan yapılmıştir1453 fatih sistemi tamamen acarlar33 sistemidir*/_SECTION_BEGIN("AuthorName");k = (GetPerformanceCounter()/100)%100; printf("GetPerformance Counter %g",k);GfxSelectFont("arial",13,800); GfxSetBkMode(1); GfxSetTextColor(colorRed); GfxTextOut("Borsabiz.com-1453 Fatih sistemi",-10+k,20); RequestTimedRefresh(10); _SECTION_END();_SECTION_BEGIN("BACK COLR"); GfxSetOverlayMode(1); GfxSetOverlayMode(1);GfxSelectFont("Tahoma", Status("pxheight")/20 ); /* Up down name*/GfxSetTextAlign( 6 );// center alignmentGfxSetTextColor( ParamColor("Text Color", ColorHSB( 42, 42, 42 ) ));GfxSetBkMode(0); // transparentGfxTextOut( Name(), Status("pxwidth")/2, Status("pxheight")/7);GfxSelectFont("Tahoma", Status("pxheight")/30 );GfxTextOut( IndustryID(1), Status("pxwidth")/2, Status("pxheight")/5 ); /* Up Down Sector*/ GfxSelectFont("Tahoma", Status("pxheight")/40 );GfxSelectFont("Tahoma", Status("pxheight")/20 ); _SECTION_BEGIN("Price");SetChartOptions(0,chartShowArrows|chartShowDates);_N(Title = StrFormat("{{NAME}} - {{INTERVAL}} {{DATE}} Open %g, Hi %g, Lo %g, Close %g (%.1f%%) {{VALUES}}", O, H, L, C, SelectedValue( ROC(C, 1 ) ) ));Plot( C, "Close", ParamColor("Color", colorBlack ), styleNoTitle | ParamStyle("Style") | GetPriceStyle() ); _SECTION_END(); _SECTION_BEGIN("EMA"); P = ParamField("Price field",-1);Periods1 = Param("Periods1", 60, 2, 500, 1, 10 );Periods2 = Param("Periods2", 360, 2, 500, 1, 10 );Periods3 = Param("Periods3", 180, 2, 500, 1, 10 );Periods4 = Param("Periods4", 270, 2, 500, 1, 10 );Periods5 = Param("Periods5", 90, 2, 500, 1, 10 );Plot( EMA( P, Periods1 ), StrFormat(_SECTION_NAME()+"(%g)", Periods1), ParamColor( "Color1", colorAqua ), ParamStyle("Style") ); Plot( EMA( P, Periods2 ), StrFormat(_SECTION_NAME()+"(%g)", Periods2), ParamColor( "Color2", colorDarkBlue ), ParamStyle("Style") ); Plot( EMA( P, Periods3 ), StrFormat(_SECTION_NAME()+"(%g)", Periods3), ParamColor( "Color3", colorGreen ), ParamStyle("Style") );Plot( EMA( P, Periods4 ), StrFormat(_SECTION_NAME()+"(%g)", Periods4), ParamColor( "Color4", colorPink ), ParamStyle("Style") );Plot( EMA( P, Periods5 ), StrFormat(_SECTION_NAME()+"(%g)", Periods5), ParamColor( "Color5", colorYellow ), ParamStyle("Style") );Buy = Cross( EMA( P, Periods4 ), EMA( P, Periods2 ) );Sell = Cross(EMA( P,Periods2 ), EMA( P, Periods1 ) );izleme= Cross(EMA( P,Periods1 ), EMA( P, Periods2 ) );izleme2=Cross(EMA( P,periods5 ), EMA ( P,periods1 ) ); PlotShapes(IIf(Buy==1, shapeHollowUpArrow , shapeNone), colorGreen, 0,Low, Offset=-30); PlotShapes(IIf(Sell==1, shapeHollowDownArrow, shapeNone), colorRed, 0,High, Offset=-30);PlotShapes(IIf(izleme==1, shapeHollowUpArrow, shapeNone), colorBlue, 0,Low, Offset=-30);PlotShapes(IIf(izleme2==1, shapeHollowDownArrow, shapeNone), colorBlue, 0,Low, Offset=-30);COLOR=IIf(Buy,colorLime,IIf(Sell,colorRed,colorWhite));Plot(C,"",COLOR,styleCandle|styleThick);PlotShapes( IIf( Buy, shapeUpTriangle, shapeNone ), colorGreen, layer = 0,yposition = L, offset = 70);PlotShapes( IIf( Sell, shapeDownTriangle, shapeNone ), colorRed, layer = 0, yposition =H, offset = 70);PlotShapes( IIf( izleme, shapeUpTriangle, shapeNone ), colorYellow, layer = 0, yposition =H, offset = 80); PlotShapes( IIf( izleme2, shapeDownTriangle, shapeNone ), colorPink, layer = 0, yposition =H, offset = 80); PlotOHLC( Null,EMA( P, Periods4 ),EMA( P, Periods2 ),Null, "", IIf(EMA( P, Periods4 )>EMA( P, Periods2 ) ,colorGreen,colorWhite), styleCloud);PlotOHLC( Null,EMA( P, Periods2 ),EMA( P, Periods1 ),Null, "", IIf(EMA( P, Periods2 )<EMA( P, Periods1 ) ,colorBlue,colorRed), styleCloud); Color = IIf( EMA(p,periods1) > EMA(p,periods2) , colorLime, IIf( EMA(p,periods2) > EMA(p,periods1), colorRed, colorGrey40 )) ; Plot( 2, "", Color, styleArea | styleOwnScale | styleNoLabel, -0.1, 30 ); _SECTION_END(); |
2 comments
Leave Comment
Please login here to leave a comment.
Back
Thanks for sharing such a nice system. What is the best Time Frame to get maximum profit.
thanks for a succesfull indicator for long term trading..