Stock Portfolio Organizer
The ultimate porfolio management solution.
Shares, Margin, CFD's, Futures and Forex
EOD and Realtime
Dividends and Trust Distributions
And Much More ....
WiseTrader Toolbox
#1 Selling Amibroker Plugin featuring:
Advanced Adaptive Indicators
Advanced Pattern Exploration
Neural Networks
And Much More ....
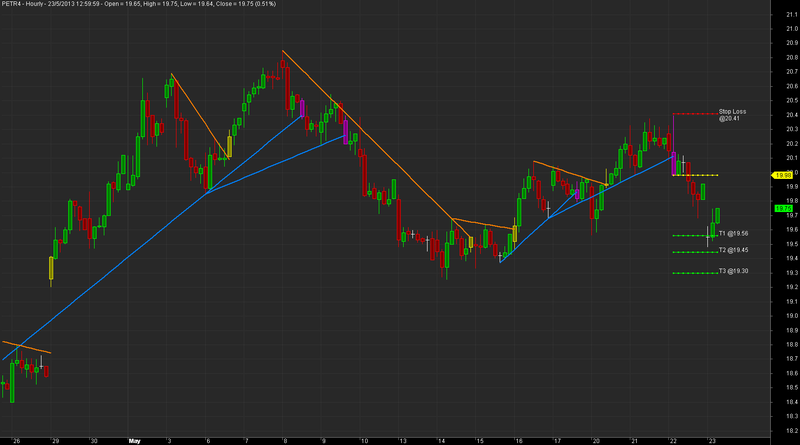
Trend Line Breakout for Amibroker (AFL)
Rating:
3 / 5 (Votes 19)
Tags:
trendline, amibroker, support, resistance
This is a swing trend line breakout without zig zag function.
My best job, try this and rate!
Screenshots
Similar Indicators / Formulas
Horizontal Line
Submitted
by senthilkumaranms over 10 years ago
Support - Resistance Level
Submitted
by tanujaya over 13 years ago
price support resistance
Submitted
by icemanc almost 13 years ago
SUPPORT & RESISTANCE
Submitted
by prasadbrao over 13 years ago
Automatic Support and Resistance with Channel
Submitted
by kaiji over 14 years ago
Support & Resistance
Submitted
by shyam242 almost 13 years ago
Indicator / Formula
Copy & Paste Friendly
SetChartOptions(0, chartShowArrows | chartShowDates);
SetChartBkColor(ParamColor("Outer Panel", colorBlack));
SetChartBkGradientFill(ParamColor("Upper Chart", colorDarkGrey), ParamColor("Lower Chart", colorDarkGrey));
GraphXSpace = Param("GraphXSpace", 10, 0, 100, 1);

colorHighliter = IIf(C >= O, ColorRGB(0, 128, 0), ColorRGB(128, 0, 0));

//Demand Point
colorDemandPoint = ParamColor("Demand Line", ColorRGB(0, 128, 255));
DemandPoint = (Ref(L, -1) < Ref(L, -2)) & (L < Ref(L, -1)) & (L < Ref(L, 1)) & (Ref(L, 1) < Ref(L, 2));

//Supply Point
colorSupplyPoint = ParamColor("Supply Line", ColorRGB(255, 128, 0));
SupplyPoint = (Ref(H, -1) > Ref(H, -2)) & (H > Ref(H, -1)) & (H > Ref(H, 1)) & (Ref(H, 1) > Ref(H, 2));

CountTrendBars = 0;
CurrentBar = BarCount - 1;
dx0 = dx1 = dy0 = dy1 = 0;
sx0 = sx1 = sy0 = sy1 = 0;
for (i = 0; i < BarCount; i++) {
	CurrentBar = (BarCount - 1) - i;
	if (DemandPoint[CurrentBar]) {
		if (dx1 == 0 & dy1 == 0) {
			dx1 = CurrentBar;
			dy1 = L[CurrentBar];
		} else {
			dx0 = CurrentBar;
			dy0 = L[CurrentBar];
		}
		if (dx0 != 0 & dx1 != 0 & dy0 != 0 & dy1 != 0) {
			if (dy0 < dy1) {
				a = (-dy0 + dy1) / (-dx0 + dx1);
				b = dy0 - dx0 * a;
				for (j = dx1; j < BarCount; j++) {
					if (j != dx1) {
						y2 = a * j + b;
						if (C[j] < y2) {
							dy1 = y2;
							dx1 = j;
							colorHighliter[j] = ColorRGB(128, 0, 128);
							CountTrendBars[j] = dx1 - dx0 - 1;
							break;
						}
					}
				}
				if (dy1 != y2) {
					dy1 = y2;
					dx1 = BarCount - 1;
				}
				Plot(LineArray(dx0, dy0, dx1, dy1, 0), "", colorDemandPoint, styleLine, Null, Null, 0, 0, 2);
			}
			dx1 = dx0;
			dy1 = dy0;
			dx0 = dy0 = 0;
		}
	}
	if (SupplyPoint[CurrentBar]) {
		if (sx1 == 0 & sy1 == 0) {
			sx1 = CurrentBar;
			sy1 = H[CurrentBar];
		} else {
			sx0 = CurrentBar;
			sy0 = H[CurrentBar];
		}
		if (sx0 != 0 & sx1 != 0 & sy0 != 0 & sy1 != 0) {
			if (sy0 > sy1) {
				a = (-sy0 + sy1) / (-sx0 + sx1);
				b = sy0 - sx0 * a;
				for (j = sx1; j < BarCount; j++) {
					if (j != sx1) {
						y2 = a * j + b;
						if (C[j] > y2) {
							sy1 = y2;
							sx1 = j;
							colorHighliter[j] = ColorRGB(128, 128, 0);
							CountTrendBars[j] = sx1 - sx0 - 1;
							break;
						}
					}
				}
				if (sy1 != y2) {
					sy1 = y2;
					sx1 = BarCount - 1;
				}
				Plot(LineArray(sx0, sy0, sx1, sy1, 0), "", colorSupplyPoint, styleLine, Null, Null, 0, 0, 2);
			}
			sx1 = sx0;
			sy1 = sy0;
			sx0 = sy0 = 0;
		}
	}
}

//Stop Loss & Targets
for (i = 0; i < BarCount; i++) {
	CurrentBar = (BarCount - 1) - i;
	if (colorHighliter[CurrentBar] == ColorRGB(128, 0, 128)) {
		StopLoss = 0;
		for (j = CurrentBar - CountTrendBars[CurrentBar]; j <= CurrentBar; j++) {
			StopLoss = Max(H[j], StopLoss);
		}
		if (CurrentBar - (BarCount - 1) != 0) {
			t1 = C[CurrentBar] - (StopLoss - C[CurrentBar]);
			t2 = C[CurrentBar] - ((StopLoss - C[CurrentBar]) * 1.272);
			t3 = C[CurrentBar] - ((StopLoss - C[CurrentBar]) * 1.618);
			Plot(LineArray(CurrentBar, StopLoss + 0.01, BarCount - 1, StopLoss + 0.01, 0), "", ColorRGB(255, 0, 0), styleDots | styleNoLabel, Null, Null, 0, 0, 1);
			Plot(LineArray(CurrentBar, C[CurrentBar], BarCount - 1, C[CurrentBar], 0), "", ColorRGB(255, 255, 0), styleDots, Null, Null, 0, 0, 1);
			Plot(LineArray(CurrentBar, t1, BarCount - 1, t1, 0), "", ColorRGB(0, 255, 0), styleDots | styleNoLabel, Null, Null, 0, 0, 1);
			Plot(LineArray(CurrentBar, t2, BarCount - 1, t2, 0), "", ColorRGB(0, 255, 0), styleDots | styleNoLabel, Null, Null, 0, 0, 1);
			Plot(LineArray(CurrentBar, t3, BarCount - 1, t3, 0), "", ColorRGB(0, 255, 0), styleDots | styleNoLabel, Null, Null, 0, 0, 1);
			PlotText("Stop Loss\n@" + WriteVal(StopLoss + 0.01, 1.2), BarCount, StopLoss + 0.01, ColorRGB(255, 255, 255));
			PlotText("T1 @" + WriteVal(t1, 1.2), BarCount, t1, ColorRGB(255, 255, 255));
			PlotText("T2 @" + WriteVal(t2, 1.2), BarCount, t2, ColorRGB(255, 255, 255));
			PlotText("T3 @" + WriteVal(t3, 1.2), BarCount, t3, ColorRGB(255, 255, 255));
		}
		break;
	}
	if (colorHighliter[CurrentBar] == ColorRGB(128, 128, 0)) {
		StopLoss = 9999;
		for (j = CurrentBar - CountTrendBars[CurrentBar]; j <= CurrentBar; j++) {
			StopLoss = Min(L[j], StopLoss);
		}
		if (CurrentBar - (BarCount - 1) != 0) {
			t1 = C[CurrentBar] + (C[CurrentBar] - StopLoss);
			t2 = C[CurrentBar] + ((C[CurrentBar] - StopLoss) * 1.272);
			t3 = C[CurrentBar] + ((C[CurrentBar] - StopLoss) * 1.618);
			Plot(LineArray(CurrentBar, StopLoss - 0.01, BarCount - 1, StopLoss - 0.01, 0), "", ColorRGB(255, 0, 0), styleDots | styleNoLabel, Null, Null, 0, 0, 1);
			Plot(LineArray(CurrentBar, C[CurrentBar], BarCount - 1, C[CurrentBar], 0), "", ColorRGB(255, 255, 0), styleDots, Null, Null, 0, 0, 1);
			Plot(LineArray(CurrentBar, t1, BarCount - 1, t1, 0), "", ColorRGB(0, 255, 0), styleDots | styleNoLabel, Null, Null, 0, 0, 1);
			Plot(LineArray(CurrentBar, t2, BarCount - 1, t2, 0), "", ColorRGB(0, 255, 0), styleDots | styleNoLabel, Null, Null, 0, 0, 1);
			Plot(LineArray(CurrentBar, t3, BarCount - 1, t3, 0), "", ColorRGB(0, 255, 0), styleDots | styleNoLabel, Null, Null, 0, 0, 1);
			PlotText("Stop Loss\n@" + WriteVal(StopLoss - 0.01, 1.2), BarCount, StopLoss - 0.01, ColorRGB(255, 255, 255));
			PlotText("T1 @" + WriteVal(t1, 1.2), BarCount, t1, ColorRGB(255, 255, 255));
			PlotText("T2 @" + WriteVal(t2, 1.2), BarCount, t2, ColorRGB(255, 255, 255));
			PlotText("T3 @" + WriteVal(t3, 1.2), BarCount, t3, ColorRGB(255, 255, 255));
		}
		break;
	}
}

//Price
SetBarFillColor(colorHighliter);
Plot(C, "Close", IIf(colorHighliter == ColorRGB(128, 0, 128), ColorRGB(255, 0, 255), IIf(colorHighliter == ColorRGB(128, 128, 0), ColorRGB(255, 255, 0), IIf(C > O, ColorRGB(0, 255, 0), IIf(C < O, ColorRGB(255, 0, 0), ColorRGB(255, 255, 255))))), styleCandle, Null, Null, 0, 0, 1);

//Volume
/*colorVolume = ParamColor("Volume Area", ColorRGB(0, 0, 0));
Plot(Volume, "", colorVolume, styleArea | styleOwnScale | styleNoLabel, Null, Null, 0, 0, 1);*/

Title = Name() + " - {{INTERVAL}} - {{DATE}} - Open = " + NumToStr(O, 1.2) + ", High = " + NumToStr(H, 1.2) + ", Low = " + NumToStr(L, 1.2) + ", Close = " + NumToStr(C, 1.2) + " (" + WriteVal(ROC(C, 1), 1.2) + "%)"; /*, Volume = " + WriteVal(Volume, 1.2);*/
33 comments
Leave Comment
Please login here to leave a comment.
Back
sir, ur afl not working showing syntax error. can u correct and post here.
I didnt find any error in above afl.
Looks good in 1st look.. will check it in real time.
Thanx you ferpa for sharing.
AFL is not working, message is “too many arguments”.
Till now two votes for 5 points and nobody seems to care that this code looks “INTO THE FUTURE”………
AFL is not working, showing “too many arguments”
AFL is not working, showing “too many arguments”
afl not working
It is a Amibroker version problem. I m not facing any problem in 5.60 version of amibroker.
If u r facing problem, Kindly remove last 0 (Zero) from every Syntax error u get..
(Example – ( 0, 0, 1); change to ( 0, 1);……..(Only remove one zero)
your problem will be solved.
Thanx you
Try use Amibroker 5.60 or later.
rob hoot, do a test.
even in 5.60 it is not running …it is saying plot(linearray) function ..
working fine in 5.60
help to find solution in 5.5 ami version
very very good, thanks
Hello Rob hoot,
i guess u dont know.. how to read this afl ..
So u r giving such statements..
Once learn how to read it.. then u will understand the importance.
Regards
This is what I found Mr. “almighty” anandnst :
It seems that the formula references FUTURE quotes.If you backtest this system you may receive outstanding results
that CAN NOT be reproduced in real trading.
2045 data bars used during this check. Total execution time: 0.00657065 sec.
Approximately 39 past and 8 future quotes are needed to calculate the formula properly
Hi,
I have not checked the afl. AmiBroker will give you this future ref. if you use peak through in your afl. Now It may not look into future when generates signal. But if you check Ami will tell you that its look into future. Thing is you must make sure that the buy/sell is based on that. Some times for information peoples use zig zag but nin system no zig zag is used, still ami will tell you that afl looks into future.
Chk this out
p=Zig(C,2);
Buy=Cross(H,Ref(H,-1));
Now the signal will not change but code checking will show you that its looking in to future. Hope this is clear for all of you
no, check this for rules:
Buy= colorHighliter == ColorRGB(128, 128, 0);
Sell= colorHighliter == ColorRGB(128, 0, 128);
add at the end of code
optimize and backtest but…
results are not very good,but the code is good and need more implementations
bye
plz someone post this code again which is usefull for all version of amibroker…and with correction of all problems …thanks in advance..
There nothing wrong in Ami 5.6
Please do use the “Copy & Paste Friendly” button to Select All and Paste into your Ami editor.
Otherwise problem still exist, you should copy & post the errors out here.
Thanks a lot
very nice formula
it gives a lot of things and easy to read
AFL is not working, message is “too many arguments”.
for amibroker older versions: remove one argument like 0 for all the errors
for message is “too many arguments”.
- Remove the last 5 arguments on the plot() statement
- for the error where last argument is 2, add a STYLE_THICK in the style column.
tks so much
Sir
Can you give me the code for Metaterminal (MT4). my email id praburaja@gmail.com
Hi I am new to Amibroker.
In this AFL I dont want the Trendline to be Plotted …… just Green Colored Arrow at TL breakout point (Buy Signal) and Red Colored Arrow at TL Breakdown point (Sell Signal)
How this can be done.
Thanx
Manoj
Good job mate.
Good one, helps a lot if u follow your other parameters like RSI or MA. But sometimes it compresses the chart for Silver, Crude and Bank nifty and makes it difficult to read the chart. Appreciate if the author Or anyone who can work on this and resolve this issue.
salaam;
i can’t understand your code;
i just want some functions like:
alertif(cross(any_trendline,price));
could you help?
good one
nice work superb
thank you sir , what a life saver indicator you have made, thanks allot