Stock Portfolio Organizer
The ultimate porfolio management solution.
Shares, Margin, CFD's, Futures and Forex
EOD and Realtime
Dividends and Trust Distributions
And Much More ....
WiseTrader Toolbox
#1 Selling Amibroker Plugin featuring:
Advanced Adaptive Indicators
Advanced Pattern Exploration
Neural Networks
And Much More ....
Beauty for Amibroker (AFL)
Rating:
2 / 5 (Votes 3)
Tags:
amibroker, moving average
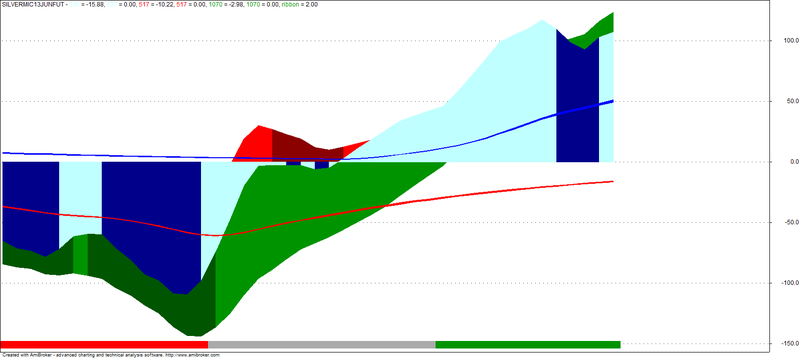
This is a combination of 5-17, 5-35 and 10-70 classic oscillators based on Weighted Moving average and trend strength. Use it for buy and sell signals on 1 minute timeframe and see the results.
Screenshots
Similar Indicators / Formulas
Hull Moving Average (HMA)
Submitted
by kaiji over 14 years ago
Smoothed MA (SSMA)
Submitted
by kelvinhand almost 11 years ago
Trend Scalping System
Submitted
by esnataraj about 14 years ago
TD DeMarker Plane
Submitted
by extremist almost 13 years ago
Guppy GMMA with "derived" Indicator
Submitted
by dalmas about 14 years ago
Buff Volume Weighted Moving Averages
Submitted
by kaiji over 14 years ago
Indicator / Formula
Copy & Paste Friendly
_SECTION_BEGIN("Beauty");

C1=WMA(H+L+C/3,5);
C2=WMA(H+L+C/3,35);
C3=C1-C2;

XPLUS=IIf(C3>0,C3,0);
XMINUS=IIf(C3<0,C3,0);
C4=EMA(XPLUS,40);
C5=EMA(XMINUS,40);
C6=C4+HHV(C4,30)*0.02;
C7=C4-HHV(C4,30)*0.02;

C8=C5+HHV(C5,30)*0.02;
C9=C5-HHV(C5,30)*0.02;

PlotOHLC(C6,C6,C7,C7,"",colorBlue,styleCloud|styleNoLabel);
PlotOHLC(C8,C8,C9,C9,"",colorRed,styleCloud|styleNoLabel);

Colorm=IIf(C3>Ref(C3,-1),colorSkyblue,colorDarkBlue);
Plot(C3,"535",Colorm,styleHistogram|styleNoLabel);
PlotOHLC(0,C3,0,0,"535",Colorm,styleCloud|styleNoLabel);

a1=WMA(H+L+C/3,5);
a2=WMA(H+L+C/3,17);
a3=a1-a2;

Colorm=IIf(a3>Ref(a3,-1),colorRed,colorDarkRed);
Plot(a3,"517",Colorm,styleHistogram|styleNoLabel);
PlotOHLC(0,a3,0,0,"517",Colorm,styleCloud|styleNoLabel);

b1=WMA(H+L+C/3,10);
b2=WMA(H+L+C/3,70);
b3=b1-b2;

Colorm=IIf(b3>Ref(b3,-1),colorGreen,colorDarkGreen);
Plot(b3,"1070",Colorm,styleHistogram|styleNoLabel);
PlotOHLC(0,b3,0,0,"1070",Colorm,styleCloud|styleNoLabel);


_SECTION_END();

_SECTION_BEGIN("trending ribbon");
uptrend=PDI()>MDI()AND Signal()<MACD();
downtrend=MDI()>PDI()AND Signal()>MACD();


Plot( 2, /* defines the height of the ribbon in percent of pane width */"ribbon",
IIf( uptrend, colorGreen, IIf( downtrend, colorRed, 0 )), /* choose color */
styleOwnScale|styleArea|styleNoLabel, -0.5, 100 );

_SECTION_END();
2 comments
Leave Comment
Please login here to leave a comment.
Back
Hi How to use it?
How to play this beauty?