Stock Portfolio Organizer
The ultimate porfolio management solution.
Shares, Margin, CFD's, Futures and Forex
EOD and Realtime
Dividends and Trust Distributions
And Much More ....
WiseTrader Toolbox
#1 Selling Amibroker Plugin featuring:
Advanced Adaptive Indicators
Advanced Pattern Exploration
Neural Networks
And Much More ....
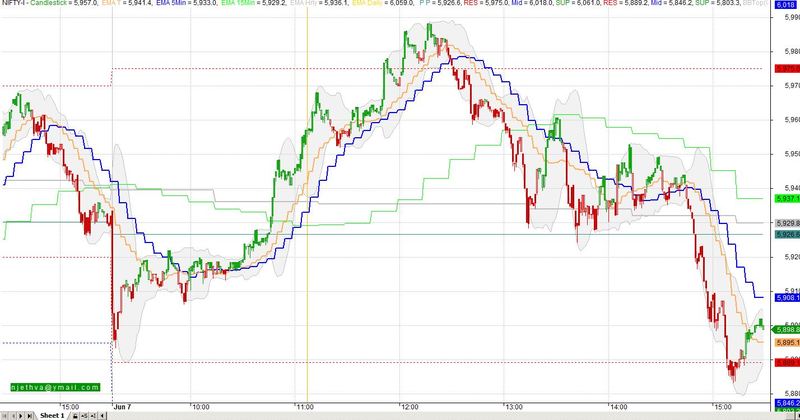
multi time frame with pivot for Amibroker (AFL)
Rating:
3 / 5 (Votes 2)
Tags:
amibroker, timeframe
hi,
find attached single formula, with multi time frame average.
this helps to find out trends in short, medium and long terms.
if you use correctly, will give good benefits.
enjoy.
Screenshots
Similar Indicators / Formulas
Different Time Frames In one Chart
Submitted
by ABUSLIMAN06 over 12 years ago
KaKa MultiTimeFrame
Submitted
by shogun over 12 years ago
RSI of WRO and WSO
Submitted
by AKJWYXZ about 12 years ago
Time Channel
Submitted
by Neo about 12 years ago
Marlyn't NewMomo
Submitted
by genkumag over 12 years ago
Weekly EMA on Daily Chart
Submitted
by rohann almost 10 years ago
Indicator / Formula
Copy & Paste Friendly
_SECTION_BEGIN("Trend Color");

HaClose =EMA((O+H+L+C)/4,3);
HaOpen = IIf(BarIndex()>0,AMA( Ref( HaClose, -1 ), 0.5 ),Open);
HaHigh = Max( H, Max( HaClose, HaOpen ) );
HaLow = Min( L, Min( HaClose, HaOpen ) );

p1=Param("Extreme period1",5,3,10);
p2=Param("Extreme period2",8,3,20);
p3=Param("Extreme period3",13,3,50);
sc=Param("Score Limit",3,1,7);

HaDiff = IIf(HaClose>HaOpen, 1, IIf((O+H+L+C)/4<HaOpen,-1,0));
HaDiff1 = IIf(HaClose>EMA(HaClose,p1), 1, IIf(HaClose<EMA(HaClose,p1),-1,0));
HaDiff2 = IIf(HaClose>EMA(HaClose,p2), 1, IIf(HaClose<EMA(HaClose,p2),-1,0));
HaDiff3 = IIf(HaClose>EMA(HaClose,p3), 1, IIf(HaClose<EMA(HaClose,p3),-1,0));
HaDiff4 = IIf(EMA(HaClose,p1)>EMA(HaClose,p2), 1, IIf(EMA(HaClose,p1)<EMA(HaClose,p2),-1,0));
HaDiff5 = IIf(EMA(HaClose,p2)>EMA(HaClose,p3), 1, IIf(EMA(HaClose,p2)<EMA(HaClose,p3),-1,0));
HaDiff6 = IIf(HaClose>Ref(HaClose,-1), 1, IIf(HaClose<Ref(HaClose,-1),-1,0));

TScore = HaDiff + HaDiff1 + HaDiff2 + HaDiff3 + HaDiff4 + HaDiff5 + HaDiff6;

FillColor = IIf(TScore>sc AND NOT (Ref(TScore,-1)<sc AND Avg<Ref(Avg,-1)),colorLime,
        IIf(TScore<-sc AND NOT (Ref(TScore,-1)>-sc AND Avg>Ref(Avg,-1)),ColorRGB(100,0,0),colorWhite));
mycolor=IIf(Tscore>0, colorGreen,colorRed);

SetBarFillColor(Fillcolor);

PlotOHLC(O,H,L,C,"Candlestick",myColor,styleCandle|styleLine);
_SECTION_END();

_SECTION_BEGIN("Min");
//

T = Param("Time", 3,1, 60,1);
TimeFrameSet( T* in1Minute ); // switch to 5 minute frame

P = Param("30Min P", 9, 3, 100,1);

ma30_9 = MA( C, P);
Plot( TimeFrameExpand( ma30_9, T* in1Minute), " EMA T",ParamColor( "T EMA", colorCycle ), ParamStyle("T Min style",styleLine | styleThick));
TimeFrameRestore(); // restore time frame to original


TimeFrameSet( in5Minute ); // switch to 5 minute frame

P = Param("5 Min P", 9, 3, 100,1);

ma5_13 = MA( C, P);
Plot( TimeFrameExpand( ma5_13, in5Minute), " EMA 5Min",ParamColor( "5Min EMA", colorCycle ), ParamStyle("5Min style",styleLine | styleThick));
TimeFrameRestore(); // restore time frame to original

TimeFrameSet( in15Minute); // switch to 15 minute frame

P = Param("15 Min P", 11, 3, 100,1);

ma5_15 = MA( C, P);
Plot( TimeFrameExpand( ma5_15, in15Minute), " EMA 15Min",ParamColor( "15Min EMA", colorCycle ), ParamStyle("15Min style",styleLine | styleNoRescale));
TimeFrameRestore(); // restore time frame to origina

TimeFrameSet( inHourly ); // switch now to hourly
P1 = Param("Hr P", 21, 3, 100,1);
mah_9 = MA( C, P1 ); //  moving average from hourly data
Plot( TimeFrameExpand( mah_9, inHourly), " EMA Hrly",ParamColor( "Hr EMA", colorCycle ), ParamStyle("Hr style",styleLine | styleThick| styleNoRescale));
TimeFrameRestore(); // restore time frame to original

TimeFrameSet( inDaily ); // switch now to hourly
P2 = Param("Daily P", 21, 3, 100,1);
mah_13D = MA( C, p2 ); // moving average from daily data
Plot( TimeFrameExpand( mah_13D, inDaily), " EMA Daily",ParamColor( "Daily EMA", colorCycle ), ParamStyle("Daily style",styleLine | styleThick| styleNoRescale));
TimeFrameRestore(); // restore time frame to original


_SECTION_END();


//---- pivot points
DayH = TimeFrameGetPrice("H", inDaily,-1);// yesterdays high
DayL = TimeFrameGetPrice("L", inDaily,-1);//low
DayC = TimeFrameGetPrice("C", inDaily,-1);//close
DayO = TimeFrameGetPrice("O", inDaily,-1);// current day open
HiDay = TimeFrameGetPrice("H", inDaily);
LoDay = TimeFrameGetPrice("L", inDaily);
PP = (DayH + DayL + DayC) / 3 ;

D = (DayH - DayL)/2;
R1 = D+DayC;

R2 = (DayH-DayL)+DayC;

R3 = R2 +D ;

S1 = DayC - D;

S2 = DayC - (DayH - DayL);

S3 = S2 - D;

style = styleLine + styleNoRescale;
rcolor = colorBlue;
scolor = colorRed;
pcolor = colorPink;

 Plot( PP, "  P P", ParamColor( "PP", colorTeal ), ParamStyle("PPStyle") );
Plot(R1,"RES",colorRed, styleLine|styleDashed| styleNoRescale );
Plot(R2,"Mid",colorBlue, styleLine|styleDashed| styleNoRescale);
Plot(R3,"SUP",colorGreen, styleLine|styleDashed|  styleNoRescale );
Plot(S1,"RES",colorRed, styleLine|styleDashed|  styleNoRescale );
Plot(s2,"Mid",colorBlue, styleLine|styleDashed| styleNoRescale);
Plot(S3,"SUP",colorGreen, styleLine|styleDashed| styleNoRescale );


_SECTION_END();

//============== TITLE ==============
_SECTION_BEGIN( "Title" );


  y = Status( "pxchartheight" );

GfxTextOut( ("n j e t h v a @ y m a i l . c o m "), 20, y -30);

_SECTION_END();

_SECTION_BEGIN("Bollinger Bands");
P = ParamField("Price field",-1);
Periods = Param("Periods", 15, 2, 100, 1 );
Width = Param("Width", 2, 0, 10, 0.05 );
Color = ParamColor("Color", colorLightGrey );
Style = ParamStyle("Style", styleLine | styleNoLabel ) | styleNoLabel;
Plot( bbt = BBandTop( P, Periods, Width ), "BBTop" + _PARAM_VALUES(), Color, Style );
Plot( bbb = BBandBot( P, Periods, Width ), "BBBot" + _PARAM_VALUES(), Color, Style );
PlotOHLC( bbt, bbt, bbb, bbb, "", ColorBlend( Color, GetChartBkColor(), 0.8 ), styleNoLabel| styleNoRescale | styleCloud | styleNoRescale, Null, Null, Null, -1 );
_SECTION_END();
1 comments
Leave Comment
Please login here to leave a comment.
Back
sir syntax error at line 27