Stock Portfolio Organizer
The ultimate porfolio management solution.
Shares, Margin, CFD's, Futures and Forex
EOD and Realtime
Dividends and Trust Distributions
And Much More ....
WiseTrader Toolbox
#1 Selling Amibroker Plugin featuring:
Advanced Adaptive Indicators
Advanced Pattern Exploration
Neural Networks
And Much More ....
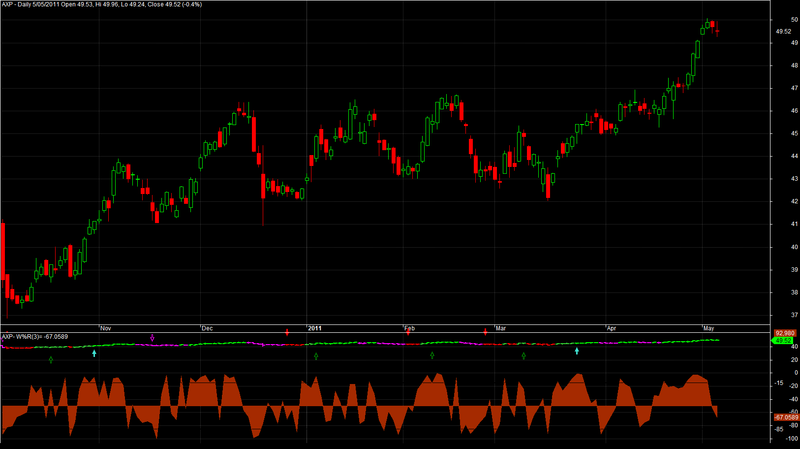
modified macd for copper , n.gas , zinc , m.oil for Amibroker (AFL)
Rating:
3 / 5 (Votes 3)
Tags:
oscillator, trading system, amibroker
hai friends
Here this afl can be used for copper , zinc , n.gas , m.oil for daaily profits. u can fix the strict stop profit for daily profit. once the buy/ sell signal generated u can fix the strict stop profit as per prescribed rules below.
copper – .75
zinc – .15
n.gas – .6
m.oil – 2
Screenshots
Similar Indicators / Formulas
Rahul Mohindar Oscillator (RMO)
Submitted
by kaiji over 14 years ago
Volatility System
Submitted
by kaiji over 14 years ago
NIFTYTIGER'S MAGIC LINES
Submitted
by niftytiger almost 12 years ago
Zerolag MACD
Submitted
by myth.goa almost 12 years ago
MACD Prediction
Submitted
by EliStern about 13 years ago
MACD MT4/MT5
Submitted
by vivek998877 over 11 years ago
Indicator / Formula
Copy & Paste Friendly
_SECTION_BEGIN("MACD");
SetChartBkColor(ParamColor("Outer panel color ",colorBlack)); // color of outer border
SetChartBkGradientFill( ParamColor("Inner panel color upper half",colorBlack),ParamColor("Inner panel color lower half",colorBlack)); // color of inner panel
VR = ParamToggle("indiactor On/off", "ON|OFF",1);
VOA=Param("band-period",10,5,20,1);
wid=Param("band-width",1,0.5,3,0.5);
A1=EMA(C,12)-EMA(C,26);
BBtop=BBandTop(A1,VOA,wid);
BBbot=BBandBot(A1,VOA,wid);
Color=IIf(a1<0 AND a1>Ref(a1,-1), colorLime,IIf(a1>0 AND a1>Ref(a1,-1),colorBrightGreen,IIf(a1>0 AND a1<Ref(a1,-1),colorCustom12,colorRed)));
if(VR==0)
{
Plot(a1,"MACD",color,styleDots+styleLine|styleLeftAxisScale);
Plot(BBtop,"BBtop",colorGreen,styleDashed|styleLeftAxisScale);
Plot(BBbot,"BBbot",colorRed,styleDashed|styleLeftAxisScale);
Plot(0,"",31,1|styleLeftAxisScale);}
Plot(C,"",Color,128+4);
MID=(BBTOP+BBBOT)/2;
Buy=A1>BBTOP AND Cross(a1,0) AND a1>Ref(a1,-1);
Sell=Cross(MID,a1);
Short=A1<BBBOT AND Cross(0,A1)AND a1<Ref(a1,-1);
Cover=Cross(A1,MID);
Buy=ExRem(Buy,Sell);
Sell=ExRem(Sell,Buy);
Short=ExRem(Short,Cover);
Cover=ExRem(Cover,Short);
PlotShapes( shapeUpArrow* Buy,colorTurquoise, 0, L, -15 );
PlotShapes( shapeHollowDownArrow* Sell, colorCustom12, 0, H, -15 );
PlotShapes( shapeHollowUpArrow* Cover,colorGreen, 0, L, -25 );
PlotShapes( shapeDownArrow* Short, colorRed, 0, H, -25 );

Filter=Buy OR Sell OR Short OR Cover;
AddColumn(IIf(Buy,66,32), "Buy", formatChar, 1,IIf(Buy,colorAqua,47));
AddColumn(IIf(Sell,83,32), "sell", formatChar, colorWhite,IIf(Sell,colorCustom12,47));
AddColumn(IIf(Short,83,32), "short", formatChar, colorWhite,IIf(Short,colorRed,47));
AddColumn(IIf(Cover,66,32), "cover", formatChar, colorWhite,IIf(Cover,colorGreen,47));
Title = EncodeColor(colorWhite)+ "MACD-BB v1.2" + " - " + Name() + " - " + EncodeColor(colorRed)+ Interval(2) + EncodeColor(colorWhite) +
" - " + Date() +" -- "+EncodeColor(colorAqua)+
WriteIf (Buy , " GO LONG at "+C+" ","")+EncodeColor(colorCustom12)+
WriteIf (Sell , " EXIT LONG at "+C+" ","")+EncodeColor(colorRed)+
WriteIf (Short , " SHORT at "+C+" ","")+EncodeColor(colorGreen)+
WriteIf (Cover , " COVER at "+C+" ","")+"\n"+
EncodeColor(colorLime)+WriteIf (a1<0 AND a1>Ref(a1,-1) , " Macd below zero line and RISING = STRENTHING "+C+" ","")+
EncodeColor(colorBrightGreen)+WriteIf (a1>0 AND a1>Ref(a1,-1) , " Macd above zero line and RISING = STRENTH++ "+C+" ","")+
EncodeColor(colorCustom12)+WriteIf (a1>0 AND a1<Ref(a1,-1) , " Macd above zero line and DECLING = weakness "+C+" ","")+
EncodeColor(colorRed)+WriteIf (a1<0 AND a1<Ref(a1,-1) , " Macd below zero line and DECLING = WEAK-- "+C+" ","");
_SECTION_END();

_SECTION_BEGIN("%R SPECIAL");
//-- Begin of Script -----
pds = Param( "Periods", 3, 2, 200);
OB = Param( "OB Level", -15, -49, 0);
OS = Param( "OS Level", -85, -100, -51);
WR = ((HHV(H,pds) - C) /(HHV (H,pds) -LLV (L,pds))) *-100;

_N(Title = StrFormat("{{NAME}}- W%%R(%g)= %g", pds, WR));

Plot( WR, "", ParamColor( "Color", colorBrown ), ParamStyle("Style"));
Plot(OB,"",colorBlack);
Plot(OS,"",colorBlack);
PlotOHLC( WR,WR,-50,V, "", colorBrown, styleCloud | styleClipMinMax, OS, OB );

//-- End of Script -----
_SECTION_END();
3 comments
Leave Comment
Please login here to leave a comment.
Back
Hi friend: Did you really test this one on your computer before putting this here?
Regards
Subash
Hi, I would like to request the Admin to remove this AFL as it doesn’t seem to be working and the Author has not replied after 2 weeks of my posting the query
Reg
Subash
It is plotting a chart for me.