Stock Portfolio Organizer
The ultimate porfolio management solution.
Shares, Margin, CFD's, Futures and Forex
EOD and Realtime
Dividends and Trust Distributions
And Much More ....
WiseTrader Toolbox
#1 Selling Amibroker Plugin featuring:
Advanced Adaptive Indicators
Advanced Pattern Exploration
Neural Networks
And Much More ....
MASK OF ZORRO SYSTEM for Amibroker (AFL)
Rating:
3 / 5 (Votes 2)
Tags:
trading system, amibroker
MASK OF ZORRO system
//Long only if green & green
//Short only if red & red
//This code MOZ V1.0 developed by Ramesh Velidi(e mail: ramesh151@yahoo.com).
//It is posted here based on his permission.
//Buy On green AND green BOTTOM RIBBON & CENTRAL colorBAND. Sell On red AND red.
//BUY ON PULLBACK OR CLOSE TO COLORBAND
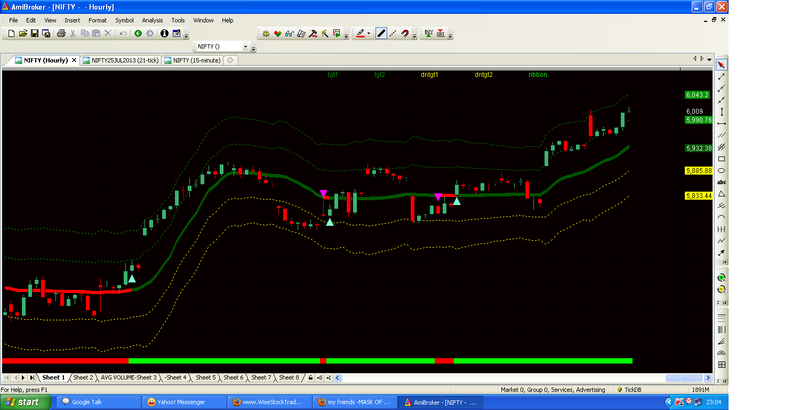
Screenshots
Similar Indicators / Formulas
EMA crossover
Submitted
by Ketan-0 about 13 years ago
Kase Peak Osc. V2 batu
Submitted
by batu1453 almost 10 years ago
Kase CD V2batu
Submitted
by batu1453 almost 10 years ago
Ichimoku
Submitted
by prashantrdx almost 10 years ago
buy and sell two EMAS
Submitted
by mundo0007 about 12 years ago
Adaptive Price Zone (APZ)
Submitted
by AndrewThomas about 13 years ago
Indicator / Formula
Copy & Paste Friendly
_SECTION_BEGIN("Price");
//MASK OF ZORRO system
//Long only if green & green
//Short only if red & red
//This code MOZ V1.0 developed by Ramesh Velidi(e mail: ramesh151@yahoo.com).
//It is posted here based on his permission.
//Buy On green AND green BOTTOM RIBBON & CENTRAL colorBAND. Sell On red AND red.
//BUY ON PULLBACK OR CLOSE TO COLORBAND


/*

Stoploss & exit rules-
Exit when any one of the RIBBON OR BAND changes the colour
No position if both the signals are different

*/
SetChartBkColor(64);
SetChartOptions(0,chartShowArrows|chartShowDates);
_N(Title = StrFormat("{{NAME}} - {{INTERVAL}} {{DATE}} Open %g, Hi %g, Lo %g, Close %g (%.1f%%) {{VALUES}}", O, H, L, C, SelectedValue( ROC( C, 1 ) ) ));
Plot( C, "Close",  colorBlack , styleNoTitle | styleCandle );
_SECTION_END();

barcolor =IIf(MACD()>0,colorBlue,colorRed);

//KAMA
//As for KAMA, Developed by Perry Kaufman, this indicator is a moving
// average that automatically adjusts its speed based on market
// volatility.
LBPeriods = 18;//Param( "LB Periods", 10, 1, 200, 1 );


FSCPeriods =2;// Param( "FSC Periods", 2, 1, 200, 1 );//ued 2
SSCPeriods = 30;//Param( "SSC Periods", 30, 1, 200, 1 );//used 100


FastSmoothConst = 2 / ( FSCPeriods + 1 );
SlowSmoothConst = 2 / ( SSCPeriods + 1 );

Direction = abs( Close - Ref( Close, -LBPeriods ) );

Volatility = Sum( abs( Close - Ref( Close, -1 ) ), LBPeriods );

EfficiencyRatio = Direction / Volatility;

SC = ( EfficiencyRatio * ( FastSmoothConst - SlowSmoothConst ) + SlowSmoothConst ) ^ 2;

KAMA = AMA( Close, SC );

ABC= KAMA ;
KKKcolor = IIf(MACD()>0,colorDarkGreen,colorRed);
PlotOHLC(ABC,ABC,0.9990*ABC,0.9990*ABC," ",KKKcolor,styleCloud);
UPtgt1= abc +2*ATR(20);
UPtgt2= abc +4*ATR(20);

Plot(UPtgt1,"tgt1",colorGreen,styleDashed);
Plot(UPtgt2,"tgt2",colorGreen,styleDashed);
dntgt1= abc -2*ATR(20);
dntgt2= abc -4*ATR(20);

Plot(dntgt1,"dntgt1",colorYellow,styleDashed);
Plot(dntgt2,"dntgt2",colorYellow,styleDashed);


_SECTION_BEGIN("Price");
SetChartOptions(0,chartShowDates|chartShowArrows|chartLogarithmic|chartWrapTitle);
//_N(Title = StrFormat("{{NAME}} +" - {{Interval}} {{Date}} Open %g, Hi %g, Lo %g, Close %g (%.1f%%) Vol " +WriteVal( V, 1.0 ) +" {{VALUES}}", O, H, L, C, SelectedValue( ROC( C, 1 )) ));
_N(Title = StrFormat("{{NAME}} - {{INTERVAL}} {{DATE}} Open %g, Hi %g, Lo %g, Close %g (%.1f%%) Vol " +WriteVal( V, 1.0 ) +" {{VALUES}}", O, H, L, C, SelectedValue( ROC( C, 1 )) ));

GraphXSpace = 5;
upzero= MACD()>0;  //SPECIAL CODE
downzero= MACD()<0;


Plot( 1.8, /* defines the height of the ribbon in percent of pane width
*/"ribbon",IIf( upzero, colorBrightGreen, IIf( downzero, colorRed, 0 )), /* choose color */
styleOwnScale|styleArea|styleNoLabel, -0.5, 100 );


Buy = MACD()>0;
Sell = MACD()<0;
Buy =ExRem(Buy,Sell); Sell =ExRem(Sell,Buy);
shape = Buy * shapeUpTriangle + Sell * shapeDownTriangle;
PlotShapes( shape, IIf( Buy, colorAqua, colorCustom12 ), 0, IIf( Buy, Low, High ) );


//==================
2 comments
Leave Comment
Please login here to leave a comment.
Back
Hi Ford7k
looks nice, let see how work during market hours
1- only white candles( upside) are plotting, how about Downside candles?
( as per you posted " screenshot of how the indicator looks" and afl color diff)
2- bellow ribbon there are require date n time
thx
NOT WORK IN AMI. 5.60 VER. ANY SOLUTION