Stock Portfolio Organizer
The ultimate porfolio management solution.
Shares, Margin, CFD's, Futures and Forex
EOD and Realtime
Dividends and Trust Distributions
And Much More ....
WiseTrader Toolbox
#1 Selling Amibroker Plugin featuring:
Advanced Adaptive Indicators
Advanced Pattern Exploration
Neural Networks
And Much More ....
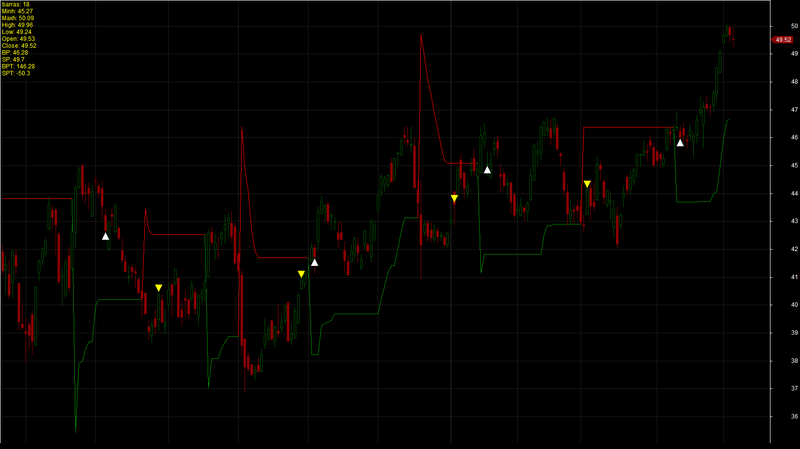
Super Trend Not Delayed for Amibroker (AFL)
Rating:
3 / 5 (Votes 6)
Tags:
amibroker
Super trend Indicator without the usual delay
Screenshots
Similar Indicators / Formulas
Kavach Of Karna v2
Submitted
by hbkwarez almost 10 years ago
Advanced Elliott Waves
Submitted
by MarcosEn over 12 years ago
3_6Day GuaiLiLv
Submitted
by motorfly over 12 years ago
Williams Alligator System
Submitted
by durgesh1712 over 12 years ago
*Level Breakout system*
Submitted
by Tinych over 12 years ago
Horizontal Live Priceline Tool
Submitted
by northstar over 12 years ago
Indicator / Formula
Copy & Paste Friendly
Plot(C,"\nPrice",IIf(C>O,ParamColor("Wick UP Color", colorDarkGreen),IIf(C<=O,ParamColor("Wick Down Color", colorDarkRed),colorLightGrey)),64,0,0,0,0);
sigwd=ParamToggle("sigchange","weekly|daily",1);
//HBS mean histogram buy sell and LHBS mean low buy high sell
Spread_Sinal_Ordem=Optimize("Spread",0,-100,100,10);
SLoss=Optimize("Stop Loss",100,50,200,10);
SGain=Optimize("Stop Gain",100,50,200,10);
field= ParamToggle("field","fieldd|fieldw",1);
font = ParamToggle("font","Show|Hide",1);
messageboard = ParamToggle("Message Board","Show|Hide",0);
prexplore= ParamToggle("perce/buysell","pers|buysell",1);
// Automatic Linear Trend Channel
// Trend is defined using an example trend: MA(cp,100)
// Amibroker AFL code by Edward Pottasch, November 2011
ApplyStop(0,2,SLoss,1);
ApplyStop(1,2,SGain,1);
Factor=Param("Factor",4.2,1,10,0.1);
Pd=Param("ATR Periods",4,1,100,1);
Up=(H+L)/2+(Factor*ATR(Pd));
Dn=(H+L)/2-(Factor*ATR(Pd));
iATR=ATR(Pd);
TrendUp=TrendDown=Null;
trend[0]=1;
changeOfTrend=0;
flag=flagh=0;

for (i = 1; i <BarCount-1; i++) {
      TrendUp[i] = Null;
      TrendDown[i] = Null;

      trend[i]=1;


      if (Close[i]>Up[i-1]) {
         trend[i]=1;
         if (trend[i-1] == -1) changeOfTrend = 1;

      }
      else if (Close[i]<Dn[i-1]) {
         trend[i]=-1;
         if (trend[i-1] == 1) changeOfTrend = 1;
      }
      else if (trend[i-1]==1) {
         trend[i]=1;
         changeOfTrend = 0;
      }
      else if (trend[i-1]==-1) {
         trend[i]=-1;
         changeOfTrend = 0;
      }


      if (trend[i]<0 && trend[i-1]>0) {
         flag=1;
      }
      else {
         flag=0;
      }

      if (trend[i]>0 && trend[i-1]<0) {
         flagh=1;

      }
      else {
         flagh=0;
      }

      if (trend[i]>0 && Dn[i]<Dn[i-1]){
         Dn[i]=Dn[i-1];
               }

      if (trend[i]<0 && Up[i]>Up[i-1])
        { Up[i]=Up[i-1];
               }

      if (flag==1)
       {  Up[i]=(H[i]+L[i])/2+(Factor*iATR[i]);;
        }
      if (flagh==1)
        { Dn[i]=(H[i]+L[i])/2-(Factor*iATR[i]);;
         }
      if (trend[i]==1) {
         TrendUp[i]=Dn[i];
         if (changeOfTrend == 1) {
            TrendUp[i-1] = TrendDown[i-1];
            changeOfTrend = 0;
         }
      }
      else if (trend[i]==-1) {
         TrendDown[i]=Up[i];
         if (changeOfTrend == 1) {
            TrendDown[i-1] = TrendUp[i-1];
            changeOfTrend = 0;
         }
      }
   }

Plot(TrendUp,"Trend",colorGreen);
Plot(TrendDown,"Down",colorRed);
bbbb=trend==1;
ssss=trend==-1;
bbbb=ExRem(bbbb,ssss);
ssss=ExRem(ssss,bbbb);

testc = IIf (C==ValueWhen(bbbb,Close,1),1,0);
testo = IIf (O==ValueWhen(bbbb,Open,1),1,0);
testl = IIf (L==ValueWhen(bbbb,Low,1),1,0);
testh = IIf (H==ValueWhen(bbbb,High,1),1,0);
testc1 = IIf (C==ValueWhen(ssss,Close,1),1,0);
testo1 = IIf (O==ValueWhen(ssss,Open,1),1,0);
testl1 = IIf (L==ValueWhen(ssss,Low,1),1,0);
testh1 = IIf (H==ValueWhen(ssss,High,1),1,0);
testcandle=testc+testo+testl+testh+testc1+testo1+testl1+testh1;


bb=trend==1;
ss=trend==-1;


// esse +100 ou -100 eh o stop (botar um param nele)
BPT=ValueWhen(ss,Close,1)+SGain;
SPT=ValueWhen(bb,Close,1)-Sloss;

BP=ValueWhen(ss,Close,1)+Spread_Sinal_Ordem;
SP=ValueWhen(bb,Close,1)-Spread_Sinal_Ordem;

barras=Min(BarsSince(bbbb),BarsSince(ssss))+1;

Minh=Ref(LLV(Low,barras),-1);
Maxh=Ref(HHV(High,barras),-1);


Buy = trend==1  AND Low<bp AND testcandle !=4 AND Maxh < BPT;
Sell = trend==-1  AND High>sp AND testcandle !=4 AND Minh > SPT;
Buy1=trend==1;
Sell1=trend==-1;

Buy=ExRem(Buy,Sell1);
Sell=ExRem(Sell,Buy1);
Short=Sell;
Cover=Buy;

BuyPrice=Min(bp,Open);
SellPrice=Max(sp,Open);
ShortPrice=Max(sp,Open);
CoverPrice=Min(bp,Open);
Title=
EncodeColor(colorYellow)+"barras: "+barras
+"\n"
+EncodeColor(colorYellow)+"Minh: "+minh
+"\n"
+EncodeColor(colorYellow)+"Maxh: "+maxh
+"\n"
+EncodeColor(colorYellow)+"High: "+H
+"\n"
+EncodeColor(colorYellow)+"Low: "+L
+"\n"
+EncodeColor(colorYellow)+"Open: "+O
+"\n"
+EncodeColor(colorYellow)+"Close: "+C
+"\n"
+EncodeColor(colorYellow)+"BP: "+BP
+"\n"
+EncodeColor(colorYellow)+"SP: "+SP
+"\n"
+EncodeColor(colorYellow)+"BPT: "+BPT
+"\n"
+EncodeColor(colorYellow)+"SPT: "+SPT;


PlotShapes( Buy * shapeUpArrow + Sell * shapeDownArrow, IIf( Buy, colorWhite, colorYellow ) );
PlotShapes( Buy * shapeUpTriangle + Sell * shapeDownTriangle, IIf( Buy, colorWhite, colorYellow ) );
2 comments
Leave Comment
Please login here to leave a comment.
Back
Hi,
Nice AFL. Kindly upload a screen shot.
Also, please suggest the time frame and the parameter values as per your experience.
Further, please modify and update it to display the value of the trend indicator.
Enjoy,
CArnot
yes my dear if show trend value then very usefull, thanks for upload