Stock Portfolio Organizer
The ultimate porfolio management solution.
WiseTrader Toolbox
#1 Selling Amibroker Plugin featuring:
Simple EMA Crossover Intraday Strategy for Amibroker (AFL)
In any carryforward strategies you need to carry forward your positions every overnight and every week even if the strategies are adopted in lower timeframes. Some people feel that carry forward strategies involves lots of overnight carry forward risk so they try to play intraday mostly. In a intraday strategy positions will be covered of mostly on the same day. Say you are adopting a certain mathematical model in your intraday trading How
did you validate whether the intraday strategy you adopted works good or not? How to backtest such intraday strategies?
Buy and Sell Rules
1)Initiate Buy if there is a bullish EMA crossover and time is greater than FirstTradeTime and less than LastTradeTime
2)Cover the buy (i.e) sell if there is a bearish EMA crossover or if time is 3:25p.m
3)Initiate Short if there is a bearish EMA crossover and time is greater than FirstTradeTime and less than LastTradeTime
4)Cover the short (i.e) cover if there is a bullish EMA crossover or if time is 3.25p.m and 11:25p.m
Buy=ExRem(Buy,Sell) ;
Sell=ExRem(Sell,Buy);
Short=Sell AND (TimeNum() >= FirstTradeTime AND TimeNum() <= LastTradeTime );
Cover=Buy OR TimeNum() >= ExitAllPositionsTime;
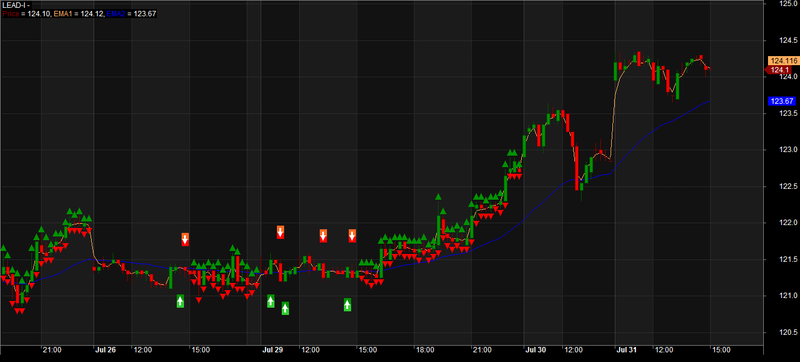
Screenshots
Similar Indicators / Formulas
Indicator / Formula
_SECTION_BEGIN("Simple EMA Crossover Intraday Strategy");
SetBarsRequired(100000,0);

GraphXSpace = 15;

SetChartOptions(0,chartShowArrows|chartShowDates);

SetChartBkColor(ParamColor("bkcolor",ColorRGB(0,0, 0)));

GfxSetBkMode(0);

GfxSetOverlayMode(1);

SetBarFillColor(IIf(C>O,ParamColor("Candle UP Color", colorGreen),IIf(C<=O,ParamColor("Candle Down Color", colorRed),colorLightGrey)));

Plot(C,"\nPrice",IIf(C>O,ParamColor("Wick UP Color", colorDarkGreen),IIf(C<=O,ParamColor("Wick Down Color", colorDarkRed),colorLightGrey)),64,0,0,0,0);


//SetTradeDelays(1,1,1,1);

SetPositionSize(100,spsShares);

FirstTradeTime = 094500;				// Earliest time to take a trade
LastTradeTime = 150000;					// Latest time to take new trades
ExitAllPositionsTime = 152500;		// Exit all trades

//parameters

//10min - 3,50
//15min - 2,36

P = ParamField("Price field",-1);
per1 = Param("EMA1",2,1,20,1);
per2 = Param("EMA2",36,1,50,1);


Buy = Cross(EMA(C,per1),EMA(C,per2)) AND (TimeNum() >= FirstTradeTime AND TimeNum() <= LastTradeTime );
Sell= Cross(EMA(C,per2),EMA(C,per1)) OR  TimeNum() >= ExitAllPositionsTime;


Buy=ExRem(Buy,Sell) ;
Sell=ExRem(Sell,Buy);

Short=Sell AND (TimeNum() >= FirstTradeTime AND TimeNum() <= LastTradeTime );
Cover=Buy OR 	 TimeNum() >= ExitAllPositionsTime;

BuyPrice=ValueWhen(Buy,C);

SellPrice=ValueWhen(Sell,C);

ShortPrice=ValueWhen(Short,C);

CoverPrice=ValueWhen(Cover,C);

Plot( EMA( P, per1 ), "EMA1", ParamColor( "Color1", colorCycle ), ParamStyle("Style") );
Plot( EMA( P, per2 ), "EMA2", ParamColor( "Color2", colorCycle ), ParamStyle("Style") );


PlotShapes(IIf(Buy, shapeSquare, shapeNone),colorGreen, 0, L, Offset=-40);
PlotShapes(IIf(Buy, shapeSquare, shapeNone),colorLime, 0,L, Offset=-50);
PlotShapes(IIf(Buy, shapeUpArrow, shapeNone),colorWhite, 0,L, Offset=-45);
PlotShapes(IIf(Sell, shapeSquare, shapeNone),colorRed, 0, H, Offset=40);
PlotShapes(IIf(Sell, shapeSquare, shapeNone),colorOrange, 0,H, Offset=50);
PlotShapes(IIf(Sell, shapeDownArrow, shapeNone),colorWhite, 0,H, Offset=-45);


PlotShapes(IIf(TimeNum() >= ExitAllPositionsTime,5,-1e10),colorGreen,0 ,H,5);
PlotShapes(IIf(TimeNum() >= ExitAllPositionsTime,6,-1e10),colorRed,0,L,5);
_SECTION_END();
2 comments
Leave Comment
Please login here to leave a comment.
Back
Facing two errors. Please do the needful pls
Syntax error in this code :
SetBarFillColor(IIf(C>O,ParamColor(“Candle UP Color”, colorGreen),IIf(C<=O,ParamColor(“Candle Down Color”, colorRed),colorLightGrey)));
Too many arguments in this code :
Plot(C,“\nPrice”,IIf(C>O,ParamColor(“Wick UP Color”, colorDarkGreen),IIf(C<=O,ParamColor(“Wick Down Color”, colorDarkRed),colorLightGrey)),64,0,0,0,0);
Thank you