Stock Portfolio Organizer
The ultimate porfolio management solution.
WiseTrader Toolbox
#1 Selling Amibroker Plugin featuring:
ULTIMATE VOLATILITY TRADING SYSTEM for Amibroker (AFL)
hi friends
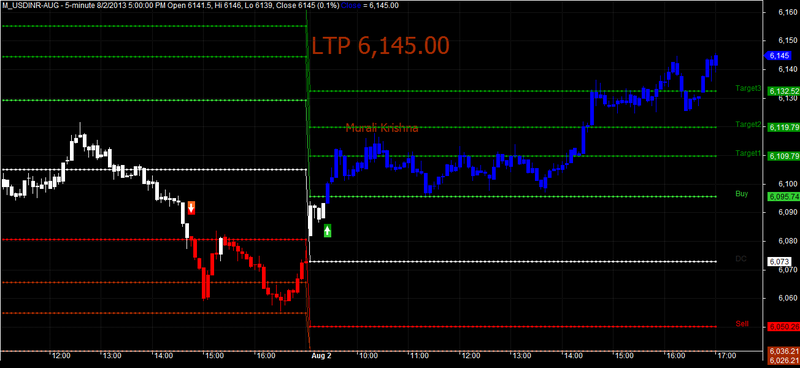
This is a developed trading system observed by daily average volatility of a scrip, it is vary in every scrip. This system calculates daily average a scrip and gives good trading levels for us.
Mostly our trades fail entering in consolidation period, this trading system shows consolidation period clearly with white color bars, up trend shows with blue color bars and down trend shows with red color bars.
It shows buy sell levels and target levels. This levels created with Fibonacci ratios
strategy: for intraday, best for 5 min time frame
1. buy above consolidation level(Buy Line Above)
2. sell below consolidation level(Sell Line Below)
3. 1st and 2nd targets are most success
3. stop loss is white middle line (yesterday’s closing price)
strategy: for positional
1. enter in every buy or sell arrow signals
2. stop loss is next opposite signal
goodness of this system is the levels and signals are same in any time frame charts
suggestions are mostly welcome!
regords
Murali krishna
Screenshots
Similar Indicators / Formulas
Indicator / Formula
_SECTION_BEGIN("Price");

SetBarsRequired(100000,0);

GraphXSpace = 15;

SetChartOptions(0,chartShowArrows|chartShowDates);

SetChartBkColor(ParamColor("bkcolor",ColorRGB(0,0, 0)));

GfxSetBkMode(0);

GfxSetOverlayMode(1);


//SetTradeDelays(1,1,1,1);

SetPositionSize(100,spsShares);


_N(Title = StrFormat("{{NAME}} - {{INTERVAL}} {{DATE}} Open %g, Hi %g, Lo %g, Close %g (%.1f%%) {{VALUES}}", O, H, L, C, SelectedValue( ROC( C, 1 ) ) ));


_SECTION_END();

DayH = TimeFrameGetPrice("H", inDaily, -1);	 DayHI = LastValue (DayH,1);// yesterdays high
DayL = TimeFrameGetPrice("L", inDaily, -1);	 DayLI = LastValue (DayL,1);	// yesterdays low
DayC = TimeFrameGetPrice("C", inDaily, -1);	 	// yesterdays close
DayO = TimeFrameGetPrice("O", inDaily);			// current day open
DayH2= TimeFrameGetPrice("H", inDaily, -2);  DayH2I = LastValue (DayH2,1); // Two days before high
DayL2= TimeFrameGetPrice("L", inDaily, -2);  DayL2I = LastValue (DayL2,1);  // Two days before low
DayH3= TimeFrameGetPrice("H", inDaily, -3);  DayH3I = LastValue (DayH3,1);  // Three days before high
DayL3= TimeFrameGetPrice("L", inDaily, -3);  DayL3I = LastValue (DayL3,1);  // Three days before low
DayH4= TimeFrameGetPrice("H", inDaily, -4);  DayH4I = LastValue (DayH4,1); // Four days before high
DayL4= TimeFrameGetPrice("L", inDaily, -4);  DayL4I = LastValue (DayL4,1);  // Four days before low
DayH5= TimeFrameGetPrice("H", inDaily, -5);  DayH5I = LastValue (DayH5,1);  // Five days before high
DayL5= TimeFrameGetPrice("L", inDaily, -5);  DayL5I = LastValue (DayL5,1);  // Five days before low
DayH6= TimeFrameGetPrice("H", inDaily, -6);  DayH6I = LastValue (DayH6,1); // Six days before high
DayL6= TimeFrameGetPrice("L", inDaily, -6);  DayL6I = LastValue (DayL6,1);  // Six days before low
DayH7= TimeFrameGetPrice("H", inDaily, -7);  DayH7I = LastValue (DayH7,1);  // Seven days before high
DayL7= TimeFrameGetPrice("L", inDaily, -7);  DayL7I = LastValue (DayL7,1);  // Seven days before low
DayH8= TimeFrameGetPrice("H", inDaily, -8);  DayH8I = LastValue (DayH8,1); // Eight days before high
DayL8= TimeFrameGetPrice("L", inDaily, -8);  DayL8I = LastValue (DayL8,1);  // Eight days before low
DayH9= TimeFrameGetPrice("H", inDaily, -9);  DayH9I = LastValue (DayH9,1);  // Nine days before high
DayL9= TimeFrameGetPrice("L", inDaily, -9);  DayL9I = LastValue (DayL9,1);  // Nine days before low
DayH10= TimeFrameGetPrice("H", inDaily, -10);  DayH10I = LastValue (DayH10,1); // Ten days before high
DayL10= TimeFrameGetPrice("L", inDaily, -10);  DayL10I = LastValue (DayL10,1);  // Ten days before low


TenDHLAvg= ( (DayH - DayL)+ (DayH2 -DayL2)+ (DayH3 - DayL3)+ (DayH4 - DayL4)+ (DayH5 - DayL5)+ (DayH6 -DayL6)+ (DayH7 - DayL7)+ (DayH8 - DayL8)+ (DayH9 - DayL9)+ (DayH10 -DayL10) )/10;

Buy= C>((DayC)+((.382)*(TenDHLAvg)));
Sell= C<((DayC)-((.382)*(TenDHLAvg)));


Buy=ExRem(Buy,Sell);
Sell=ExRem(Sell,Buy);

Short=Sell;

Cover=Buy;


BuyPrice=ValueWhen(Buy,C);

SellPrice=ValueWhen(Sell,C);

ShortPrice=ValueWhen(Short,C);

CoverPrice=ValueWhen(Cover,C);


PlotShapes(IIf(Buy, shapeSquare, shapeNone),colorGreen, 0, L, Offset=-40);

PlotShapes(IIf(Buy, shapeSquare, shapeNone),colorLime, 0,L, Offset=-50);

PlotShapes(IIf(Buy, shapeUpArrow, shapeNone),colorWhite, 0,L, Offset=-45);

PlotShapes(IIf(Short, shapeSquare, shapeNone),colorRed, 0, H, Offset=40);

PlotShapes(IIf(Short, shapeSquare, shapeNone),colorOrange, 0,H, Offset=50);

PlotShapes(IIf(Short, shapeDownArrow, shapeNone),colorWhite, 0,H, Offset=-45);


SetPositionSize(300,spsShares);
ApplyStop(0,1,10,1);
//-----------end--------------
Long=Flip(Buy,Sell);
Shrt=Flip(Sell,Buy);

BuyPrice=ValueWhen(Buy,C);
SellPrice=ValueWhen(Sell,C);


Edc=(
WriteIf (Buy AND Ref(shrt,-1), " BUY at "+C+"  ","")+
WriteIf (Sell AND Ref(Long,-1), " SEll at "+C+"  ","")
);
_SECTION_END();

trendup = IIf(C>((DayC)+((.382)*(TenDHLAvg))), colorBlue, colorWhite);
trendcolor = IIf(C<((DayC)-((.382)*(TenDHLAvg))), colorRed, trendup);
Plot( C, "Close", trendcolor, styleCandle | styleThick );


numbars = LastValue(Cum(Status("barvisible")));
hts  = -33.5;

// Volatility Levels //
DC =    DayC;                               DCI = LastValue (DC,1);     // Yesterday Close
BY  =  ((DayC)+((.382)*(TenDHLAvg)));       BYI = LastValue (BY,1);     // Buy Entry Line
BT1  =  ((DayC)+((.618)*(TenDHLAvg)));      BT1I = LastValue (BT1,1);   // Buy Target Line 1
BT2  =  ((DayC)+((.786)*(TenDHLAvg)));      BT2I = LastValue (BT2,1);   // Buy Target Line 2
BT3  =  ((DayC)+(TenDHLAvg));               BT3I = LastValue (BT3,1);   // Buy Target Line 3
SH  =  ((DayC)-((.382)*(TenDHLAvg)));       SHI = LastValue (SH,1);   // Sell Entry Line
ST1  =  ((DayC)-((.618)*(TenDHLAvg)));      ST1I = LastValue (ST1,1);   // Sell Target Line 1
ST2  =  ((DayC)-((.786)*(TenDHLAvg)));      ST2I = LastValue (ST2,1);   // Sell Target Line 2
ST3 =  ((DayC)-(TenDHLAvg));                ST3I = LastValue (ST3,1);   // Sell Target Line 3

vvl = ParamToggle("Trend Levels","Hide|Show",1);
if(vvl==1)  {
  Plot(DC, "DC",colorWhite,styleDots|styleLine|styleNoRescale|styleNoTitle);
  Plot(BY, "BY",colorLime,styleDots|styleLine|styleNoRescale|styleNoTitle);
  Plot(BT1, "BT1",colorGreen,styleDots|styleLine|styleNoRescale|styleNoTitle);
  Plot(BT2, "BT2",colorGreen,styleDots|styleLine|styleNoRescale|styleNoTitle);
  Plot(BT3, "BT3",colorGreen,styleDots|styleLine|styleNoRescale|styleNoTitle);
  Plot(SH, "SH",colorRed,styleDots|styleLine|styleNoRescale|styleNoTitle);
  Plot(ST1, "ST1",colorBrown,styleDots|styleLine|styleNoRescale|styleNoTitle);
  Plot(ST2, "ST2",colorBrown,styleDots|styleLine|styleNoRescale|styleNoTitle);
  Plot(ST3, "ST3",colorBrown,styleDots|styleLine|styleNoRescale|styleNoTitle);

  PlotText(" DC ",  LastValue(BarIndex())-(numbars/Hts), DCI, colorDarkGrey);
  PlotText(" Buy " ,    LastValue(BarIndex())-(numbars/Hts), BYI, colorLime);
  PlotText(" Target1 " ,    LastValue(BarIndex())-(numbars/Hts), BT1I, colorGreen);
  PlotText(" Target2 " ,    LastValue(BarIndex())-(numbars/Hts), BT2I, colorGreen);
  PlotText(" Target3 " ,    LastValue(BarIndex())-(numbars/Hts), BT3I, colorGreen);
  PlotText(" Sell " ,    LastValue(BarIndex())-(numbars/Hts), SHI, colorRed);
  PlotText(" Target1 " ,    LastValue(BarIndex())-(numbars/Hts), ST1I, colorBrown);
  PlotText(" Target2 " ,    LastValue(BarIndex())-(numbars/Hts), ST2I, colorBrown);
  PlotText(" Target3 " ,    LastValue(BarIndex())-(numbars/Hts), ST3I, colorBrown);
}

_SECTION_BEGIN("Background text");
C11=ParamColor("up panel",colorBlack );
C12=ParamColor("dn panel",colorBlack );
C13=Param("fonts",20,10,30,1 );
C14=Param("left-right",2.1,1.0,5.0,0.1 );
C15=Param("up-down",12,1,20,1 );
Miny = Status("axisminy");
Maxy = Status("axismaxy");
lvb = Status("lastvisiblebar");
fvb = Status("firstvisiblebar");
pxwidth = Status("pxwidth");
pxheight = Status("pxheight");
GfxSetBkMode( 0 );
GfxSetOverlayMode(1);
GfxGradientRect(0,0,pxwidth, pxheight, C11, C12 );
GfxSelectFont("Tahoma", Status("pxheight")/C13 );
GfxSetTextColor(colorBrown);
GfxSetTextAlign( 6 );
GfxTextOut( "LTP "+WriteVal(C,1.2), Status("pxwidth")/C14, Status("pxheight")/C15);
GfxSelectFont("Tahoma", Status("pxheight")/C13*0.5 );
GfxSetTextColor(colorBrown);
GfxTextOut( " Murali Krishna", Status("pxwidth")/C14, Status("pxheight")/C15*4 );
GfxSelectFont("MS Sans Serif", 10, 500, False, False, 0);
GfxSetTextColor(colorYellow);
GfxTextOut(""+edc+"", Status("pxwidth")/1.15, Status("pxheight")/C15*0.3 );
22 comments
Leave Comment
Please login here to leave a comment.
Back
Thanks a Lot for sharing.
murari G,,,
its good ,,
can i parabolic sar use above your system for entry & exit ….. quick entry exit for usdinr,,,,,, CURRENCY TRADING -
WHATS YOUR ADVISE ? -
Thanks a Lot for sharing.
does not look like uploaded screen shot
thanks dineshpal ,mohanjamkhekdar and davidalan
ok try , but price moves up and down every day, so many indicators gives many signals (buy & sell) per day, this system concept is gives mostly one side trend indicates per day,@ mohanjamkhekdar
any as ur like indicator and this system compare one screen window and zoom out one month data from any scrip, this system gives one r two trends and 4,5 tradings per weekly,
at the same time most indicators gives too many signals per daily and weekly, how much stress our nervous..? many tips providing companies and experts put this type of calls and trading ideas in daily, so think this way. thanks
@ davidalan
set ur Amibbroker – Tools – Preferences – Color – “Use one color for entire candle and solid body of Up candle”,
apply then ur screen looks like uploaded screen shot
Murali,
you can also make the TenDays a variable like:
@MurliKrishna
if you give permisson, will post some upgradatiion in this AFl … !
super sir i will dry
thank u
all the best for u r service continue
sir
intraday 5 minits
position trader which time frame use for arrow
@ empottasch,
thank u very much sir, actually this case( afl code writing) I do not have much knowledge, Thanks for your help.
@divyesh,
My thoughts are always with my permission for your help in doing develop.
thanks again
krishna
@ dpy2012
position trader also 5 min , because once signal is comes this system it generates maximum same all time frames , just price closing was change, so 5 min tfm getting early giving and low price rate, check the charts 5 min tfm and hourly tfms once again, signals r maximum same but price closing was slightly deference, so i think 5min tfm is good.
Hi, Muralikrishna,
Can you add code given by “empottasch” and post here or even “empottasch” does it it will be really appreciated.
Regards,
Sam21
bro. above afl i can not see in 5.40 version any one help how can i solve ???
@sam21
above code lines from 32 to 56 cut and paste below empottasch code
@anup82
go below download link and download Amibroker 5.60.3 version, after it download complete then install, automatically upgrade ur amibroker ok,
http://www.amibroker.com/download.html
try on other method change code line no 9 cut and paste below code
SetChartBkColor=(ParamColor("bkcolor",ColorRGB(0,0, 0)));thanks
sir
in my chart only white lines and whitecandles are present no buy or sell arrow or green or red lines are displayed plz help .
@reenath
this system calculates minimum ten days real-time data and provide signals so ur data if less then ten days data it is not provide signals , i know some data providing companies provide only 5 days before data, so do this one
change above code line no. 56 cut and paste below code
TenDHLAvg= ( (DayH - DayL)+ (DayH2 -DayL2)+ (DayH3 - DayL3) )/3;problem solved
thanks sir .it works
ur mobile no
@rajasubramanian
Ask your doubts here, there will be good, and this Upgrade version is here,
http://www.wisestocktrader.com/indicators/4059-ultimate-volatility-trading-system-v-2
Hello
Are you available to do AFL coding? Where to contact you? email?
krishna_vaastu@yahoo.com
code profile shows this system uses future quotes for signal..do not use