Stock Portfolio Organizer
The ultimate porfolio management solution.
Shares, Margin, CFD's, Futures and Forex
EOD and Realtime
Dividends and Trust Distributions
And Much More ....
WiseTrader Toolbox
#1 Selling Amibroker Plugin featuring:
Advanced Adaptive Indicators
Advanced Pattern Exploration
Neural Networks
And Much More ....
ULTIMATE VOLATILITY TRADING SYSTEM Againts the Trend for Intraday Only for Amibroker (AFL)
Rating:
3 / 5 (Votes 6)
Tags:
trading system, amibroker
this is modified AFL of http://www.wisestocktrader.com/indicators/3881-ultimate-volatility-trading-system by Murlikrishna.
Thank you very much for giving me permission for posting Modification Version.
this modification is purly for intraday trade purpose.
i gave name Againts the Trend or Catch the Falling Knife Trade.
mind well Catch the falling Knife may bleeds you….! ;-)
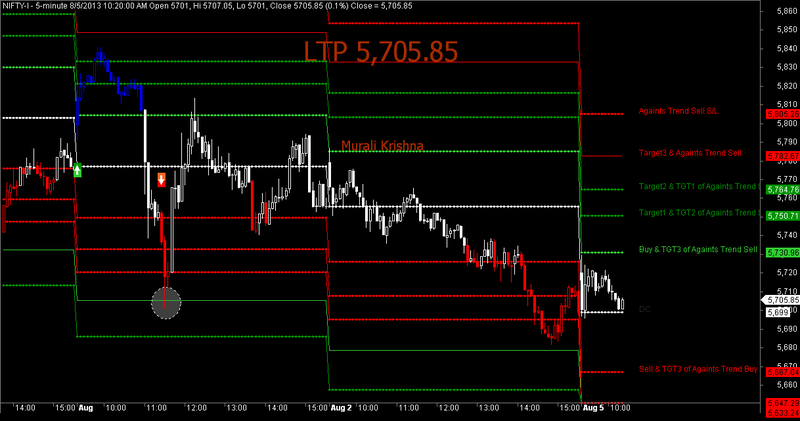
strategy: for intraday, best for 5 min time frame
1. buy @ or Above Targers3 or Plain Green line
2. sell @ or below Target3 or Plain Red Line
3. 1st and 2nd targets are most success
3. stop loss is Dotted last Line…..!
Enjoy Happy Trading………!
Screenshots
Similar Indicators / Formulas
EMA crossover
Submitted
by Ketan-0 about 13 years ago
Kase Peak Osc. V2 batu
Submitted
by batu1453 almost 10 years ago
Kase CD V2batu
Submitted
by batu1453 almost 10 years ago
Ichimoku
Submitted
by prashantrdx almost 10 years ago
buy and sell two EMAS
Submitted
by mundo0007 about 12 years ago
Adaptive Price Zone (APZ)
Submitted
by AndrewThomas about 13 years ago
Indicator / Formula
Copy & Paste Friendly
_SECTION_BEGIN("Price");

SetBarsRequired(100000,0);

GraphXSpace = 15;

SetChartOptions(0,chartShowArrows|chartShowDates);

SetChartBkColor(ParamColor("bkcolor",ColorRGB(0,0, 0)));

GfxSetBkMode(0);

GfxSetOverlayMode(1);


//SetTradeDelays(1,1,1,1);

SetPositionSize(100,spsShares);


_N(Title = StrFormat("{{NAME}} - {{INTERVAL}} {{DATE}} Open %g, Hi %g, Lo %g, Close %g (%.1f%%) {{VALUES}}", O, H, L, C, SelectedValue( ROC( C, 1 ) ) ));


_SECTION_END();

DayH = TimeFrameGetPrice("H", inDaily, -1);	 DayHI = LastValue (DayH,1);// yesterdays high
DayL = TimeFrameGetPrice("L", inDaily, -1);	 DayLI = LastValue (DayL,1);	// yesterdays low
DayC = TimeFrameGetPrice("C", inDaily, -1);	 	// yesterdays close
DayO = TimeFrameGetPrice("O", inDaily);			// current day open
DayH2= TimeFrameGetPrice("H", inDaily, -2);  DayH2I = LastValue (DayH2,1); // Two days before high
DayL2= TimeFrameGetPrice("L", inDaily, -2);  DayL2I = LastValue (DayL2,1);  // Two days before low
DayH3= TimeFrameGetPrice("H", inDaily, -3);  DayH3I = LastValue (DayH3,1);  // Three days before high
DayL3= TimeFrameGetPrice("L", inDaily, -3);  DayL3I = LastValue (DayL3,1);  // Three days before low
DayH4= TimeFrameGetPrice("H", inDaily, -4);  DayH4I = LastValue (DayH4,1); // Four days before high
DayL4= TimeFrameGetPrice("L", inDaily, -4);  DayL4I = LastValue (DayL4,1);  // Four days before low
DayH5= TimeFrameGetPrice("H", inDaily, -5);  DayH5I = LastValue (DayH5,1);  // Five days before high
DayL5= TimeFrameGetPrice("L", inDaily, -5);  DayL5I = LastValue (DayL5,1);  // Five days before low
DayH6= TimeFrameGetPrice("H", inDaily, -6);  DayH6I = LastValue (DayH6,1); // Six days before high
DayL6= TimeFrameGetPrice("L", inDaily, -6);  DayL6I = LastValue (DayL6,1);  // Six days before low
DayH7= TimeFrameGetPrice("H", inDaily, -7);  DayH7I = LastValue (DayH7,1);  // Seven days before high
DayL7= TimeFrameGetPrice("L", inDaily, -7);  DayL7I = LastValue (DayL7,1);  // Seven days before low
DayH8= TimeFrameGetPrice("H", inDaily, -8);  DayH8I = LastValue (DayH8,1); // Eight days before high
DayL8= TimeFrameGetPrice("L", inDaily, -8);  DayL8I = LastValue (DayL8,1);  // Eight days before low
DayH9= TimeFrameGetPrice("H", inDaily, -9);  DayH9I = LastValue (DayH9,1);  // Nine days before high
DayL9= TimeFrameGetPrice("L", inDaily, -9);  DayL9I = LastValue (DayL9,1);  // Nine days before low
DayH10= TimeFrameGetPrice("H", inDaily, -10);  DayH10I = LastValue (DayH10,1); // Ten days before high
DayL10= TimeFrameGetPrice("L", inDaily, -10);  DayL10I = LastValue (DayL10,1);  // Ten days before low


TenDHLAvg= ( (DayH - DayL)+ (DayH2 -DayL2)+ (DayH3 - DayL3)+ (DayH4 - DayL4)+ (DayH5 - DayL5)+ (DayH6 -DayL6)+ (DayH7 - DayL7)+ (DayH8 - DayL8)+ (DayH9 - DayL9)+ (DayH10 -DayL10) )/10;

Buy= C>((DayC)+((.382)*(TenDHLAvg)));
Sell= C<((DayC)-((.382)*(TenDHLAvg)));


Buy=ExRem(Buy,Sell);
Sell=ExRem(Sell,Buy);

Short=Sell;

Cover=Buy;


BuyPrice=ValueWhen(Buy,C);

SellPrice=ValueWhen(Sell,C);

ShortPrice=ValueWhen(Short,C);

CoverPrice=ValueWhen(Cover,C);


PlotShapes(IIf(Buy, shapeSquare, shapeNone),colorGreen, 0, L, Offset=-40);

PlotShapes(IIf(Buy, shapeSquare, shapeNone),colorLime, 0,L, Offset=-50);

PlotShapes(IIf(Buy, shapeUpArrow, shapeNone),colorWhite, 0,L, Offset=-45);

PlotShapes(IIf(Short, shapeSquare, shapeNone),colorRed, 0, H, Offset=40);

PlotShapes(IIf(Short, shapeSquare, shapeNone),colorOrange, 0,H, Offset=50);

PlotShapes(IIf(Short, shapeDownArrow, shapeNone),colorWhite, 0,H, Offset=-45);


SetPositionSize(300,spsShares);
ApplyStop(0,1,10,1);
//-----------end--------------
Long=Flip(Buy,Sell);
Shrt=Flip(Sell,Buy);

BuyPrice=ValueWhen(Buy,C);
SellPrice=ValueWhen(Sell,C);


Edc=(
WriteIf (Buy AND Ref(shrt,-1), " BUY at "+C+"  ","")+
WriteIf (Sell AND Ref(Long,-1), " SEll at "+C+"  ","")
);
_SECTION_END();

trendup = IIf(C>((DayC)+((.382)*(TenDHLAvg))), colorBlue, colorWhite);
trendcolor = IIf(C<((DayC)-((.382)*(TenDHLAvg))), colorRed, trendup);
Plot( C, "Close", trendcolor, styleCandle | styleThick );


numbars = LastValue(Cum(Status("barvisible")));
hts  = -33.5;

// Volatility Levels //
DC =    DayC;                               DCI = LastValue (DC,1);     // Yesterday Close
BY  =  ((DayC)+((.382)*(TenDHLAvg)));       BYI = LastValue (BY,1);     // Buy Entry Line
BT1  =  ((DayC)+((.618)*(TenDHLAvg)));      BT1I = LastValue (BT1,1);   // Buy Target Line 1
BT2  =  ((DayC)+((.786)*(TenDHLAvg)));      BT2I = LastValue (BT2,1);   // Buy Target Line 2
BT3  =  ((DayC)+(TenDHLAvg));               BT3I = LastValue (BT3,1);   // Buy Target Line 3
BT4 = ((DayC)+((1.27)*(TenDHLAvg)));  				BT4I = LastValue (BT4,1);   // Againts Trend Sell S/L
SH  =  ((DayC)-((.382)*(TenDHLAvg)));       SHI = LastValue (SH,1);   // Sell Entry Line
ST1  =  ((DayC)-((.618)*(TenDHLAvg)));      ST1I = LastValue (ST1,1);   // Sell Target Line 1
ST2  =  ((DayC)-((.786)*(TenDHLAvg)));      ST2I = LastValue (ST2,1);   // Sell Target Line 2
ST3 =  ((DayC)-(TenDHLAvg));                ST3I = LastValue (ST3,1);   // Sell Target Line 3
ST4=((DayC)-((1.27)*(TenDHLAvg)));  					ST4I = LastValue (ST4,1);   // Againts Trend buy S/L
vvl = ParamToggle("Trend Levels","Hide|Show",1);
if(vvl==1)  {
  Plot(DC, "DC",colorWhite,styleDots|styleLine|styleNoRescale|styleNoTitle);
  Plot(BY, "BY",colorLime,styleDots|styleLine|styleNoRescale|styleNoTitle);
  Plot(BT1, "BT1",colorGreen,styleDots|styleLine|styleNoRescale|styleNoTitle);
  Plot(BT2, "BT2",colorGreen,styleDots|styleLine|styleNoRescale|styleNoTitle);
  Plot(BT3, "BT3",colorRed,styleLine|styleNoRescale|styleNoTitle);
  Plot(BT4, "Sell",colorRed,styleDots|styleLine|styleNoRescale|styleNoTitle);
  Plot(SH, "SH",colorRed,styleDots|styleLine|styleNoRescale|styleNoTitle);
  Plot(ST1, "ST1",colorRed,styleDots|styleLine|styleNoRescale|styleNoTitle);
  Plot(ST2, "ST2",colorRed,styleDots|styleLine|styleNoRescale|styleNoTitle);
  Plot(ST3, "ST3",colorLime,styleLine|styleNoRescale|styleNoTitle);
  Plot(ST4, "Buy",colorGreen,styleDots|styleLine|styleNoRescale|styleNoTitle);

  PlotText(" DC ",  LastValue(BarIndex())-(numbars/Hts), DCI, colorDarkGrey);
  PlotText(" Buy & TGT3 of Againts Trend Sell" ,    LastValue(BarIndex())-(numbars/Hts), BYI, colorLime);
  PlotText(" Target1 & TGT2 of Againts Trend Sell" ,    LastValue(BarIndex())-(numbars/Hts), BT1I, colorGreen);
  PlotText(" Target2 & TGT1 of Againts Trend Sell " ,    LastValue(BarIndex())-(numbars/Hts), BT2I, colorGreen);
  PlotText(" Target3 & Againts Trend Sell" ,    LastValue(BarIndex())-(numbars/Hts), BT3I, colorRed);
  PlotText(" Againts Trend Sell S/L " ,    LastValue(BarIndex())-(numbars/Hts), BT4I, colorRed);
  PlotText(" Sell & TGT3 of Againts Trend Buy" ,    LastValue(BarIndex())-(numbars/Hts), SHI, colorRed);
  PlotText(" Target1 & TGT2 of Againts Trend Buy" ,    LastValue(BarIndex())-(numbars/Hts), ST1I, colorRed);
  PlotText(" Target2 & TGT1 of Againts Trend Buy" ,    LastValue(BarIndex())-(numbars/Hts), ST2I, colorRed);
  PlotText(" Target3 & Againts Trend Buy" ,    LastValue(BarIndex())-(numbars/Hts), ST3I, colorLime);
  PlotText(" Againts Trend Buy S/L " ,    LastValue(BarIndex())-(numbars/Hts), ST4I, colorGreen);
}

_SECTION_BEGIN("Background text");
C11=ParamColor("up panel",colorBlack );
C12=ParamColor("dn panel",colorBlack );
C13=Param("fonts",20,10,30,1 );
C14=Param("left-right",2.1,1.0,5.0,0.1 );
C15=Param("up-down",12,1,20,1 );
Miny = Status("axisminy");
Maxy = Status("axismaxy");
lvb = Status("lastvisiblebar");
fvb = Status("firstvisiblebar");
pxwidth = Status("pxwidth");
pxheight = Status("pxheight");
GfxSetBkMode( 0 );
GfxSetOverlayMode(1);
GfxGradientRect(0,0,pxwidth, pxheight, C11, C12 );
GfxSelectFont("Tahoma", Status("pxheight")/C13 );
GfxSetTextColor(colorBrown);
GfxSetTextAlign( 6 );
GfxTextOut( "LTP "+WriteVal(C,1.2), Status("pxwidth")/C14, Status("pxheight")/C15);
GfxSelectFont("Tahoma", Status("pxheight")/C13*0.5 );
GfxSetTextColor(colorBrown);
GfxTextOut( " Murali Krishna", Status("pxwidth")/C14, Status("pxheight")/C15*4 );
GfxSelectFont("MS Sans Serif", 10, 500, False, False, 0);
GfxSetTextColor(colorYellow);
GfxTextOut(""+edc+"", Status("pxwidth")/1.15, Status("pxheight")/C15*0.3 );
8 comments
Leave Comment
Please login here to leave a comment.
Back
@anup82,
dear murlikrishna said to upgrade you version. have you done it ?
RESPECTED DIVYESH SIR
CAN YOU PLZ GIVE SOME DETAILED EXPLANATION REAGARDING HOW TO USE THIS AFL…..
WAITING FOR YOUR VALUABLE REPLY
@ darshit,
i have explained in description although…..
strategy: for intraday, best for 5 min time frame
1. buy @ or Above Targers3 or Plain Green line
2. sell @ or below Target3 or Plain Red Line
3. 1st and 2nd targets are most success
3. stop loss is Dotted last Line…..!
why not showing anything
@ all Experts….!
can anyone plz write code for the condition….
if a candle close above 21 Ema, i want to buy 1 points above that candle’s high & if close below 21 EMA , want to close 1 point below that candle’s low…..!
waiting for your valueble replays……!
prasadmuni, anandst….and experts whome i dont know……!
how can i change number of days in this afl , its fantastic indicator but i need simple way to change no of days so that i can adjust as per my need.