Stock Portfolio Organizer
The ultimate porfolio management solution.
Shares, Margin, CFD's, Futures and Forex
EOD and Realtime
Dividends and Trust Distributions
And Much More ....
WiseTrader Toolbox
#1 Selling Amibroker Plugin featuring:
Advanced Adaptive Indicators
Advanced Pattern Exploration
Neural Networks
And Much More ....
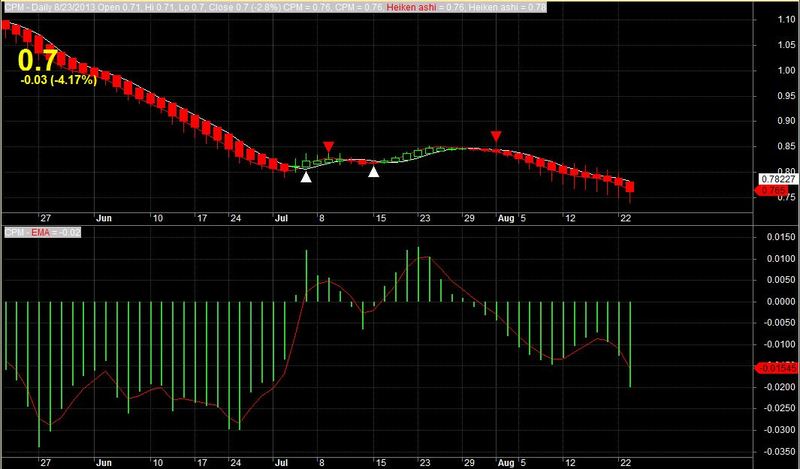
Heiken Ashi Histogram for Amibroker (AFL)
Rating:
4 / 5 (Votes 3)
Tags:
amibroker
This simple code is for easily visualize the changes of the body of the Heiken Ashi candle.
I also included the Heiken Ashi afl which I use for the coding. The Heiken Ashi and the histogram are 2 separate afl codes.
Screenshots
Similar Indicators / Formulas
Kavach Of Karna v2
Submitted
by hbkwarez almost 10 years ago
Advanced Elliott Waves
Submitted
by MarcosEn over 12 years ago
3_6Day GuaiLiLv
Submitted
by motorfly over 12 years ago
Williams Alligator System
Submitted
by durgesh1712 over 12 years ago
*Level Breakout system*
Submitted
by Tinych over 12 years ago
Horizontal Live Priceline Tool
Submitted
by northstar over 12 years ago
Indicator / Formula
Copy & Paste Friendly
//Heiken Ashi candlestick formula//

SetChartBkGradientFill( ParamColor("BgTop", colorBlack),ParamColor("BgBottom", colorBlack),ParamColor("Titleblock",colorBlack ));
SetChartOptions(0,chartShowArrows|chartShowDates);
GraphXSpace=5;
p=Param("Period",6,2,30,1);
Om=MA(O,p);
hm=MA(H,p);
lm=MA(L,p);
Cm=MA(C,p);
HACLOSE=(Om+Hm+Lm+Cm)/4;
HaOpen = AMA( Ref( HaClose, -1 ), 0.5 );
HaHigh = Max( Hm, Max( HaClose, HaOpen ) );
HaLow = Min( Lm, Min( HaClose, HaOpen ) );
PlotOHLC( HaOpen, HaHigh, HaLow, HaClose, "" + Name(), colorWhite, styleCandle | styleNoLabel );
_SECTION_END();


_SECTION_BEGIN("Heiken Ashi Smoothed");
SetChartBkGradientFill( ParamColor("BgTop", colorBlack),ParamColor("BgBottom", colorBlack),ParamColor("Titleblock",colorBlack ));
SetChartOptions(0,chartShowArrows|chartShowDates);
GraphXSpace=5;
p=Param("Period",6,2,30,1);
Om=MA(O,p);
hm=MA(H,p);
lm=MA(L,p);
Cm=MA(C,p);
HACLOSE=(Om+Hm+Lm+Cm)/4;
HaOpen = AMA( Ref( HaClose, -1 ), 0.5 );
HaHigh = Max( Hm, Max( HaClose, HaOpen ) );
HaLow = Min( Lm, Min( HaClose, HaOpen ) );
PlotOHLC( HaOpen, HaHigh, HaLow, HaClose, "" + Name(), colorWhite, styleCandle | styleNoLabel );
_SECTION_END();
Line=ParamToggle("Show Line chart also","Hide|Show",0);
if(Line==1) {
Plot(C,"Close",colorWhite,styleLine);
}


a=LinearReg(HaClose, 5 ) ;
b=LinearReg( HaClose, 5 ) ;

Plot( IIf(HaHigh>HaOpen,a,b), _DEFAULT_NAME(), colorRed, ParamStyle("Style") );

Plot( LinearReg( HaOpen, 5 ), _DEFAULT_NAME(), colorWhite, ParamStyle("Style") );

_SECTION_BEGIN("kgs 12 26 ma buy sell");


a=MA(C,3) ;
b=MA(C,15) ;

Buy = Cross( a,b );
Sell = Cross( b,a );
//Short = Sell;
//Cover = Buy;

//AlertIf( Buy, "", "MA cross BUY", 1,1+2 );

//AlertIf( Sell, "", "MA cross SELL", 2 ,1+2);

PlotShapes( shapeUpTriangle*Buy, colorWhite, 0, L, -20 );
PlotShapes( shapeDownTriangle*Sell, colorRed, 0, H, -20 );
_SECTION_END();


_SECTION_BEGIN("Magnified Market Price");
//by Vidyasagar, vkunisetty@yahoo.com//
FS=Param("Font Size",30,30,100,1);
GfxSelectFont("Arial", FS, 900, italic = False, underline = False, True );
GfxSetBkMode( colorWhite );
GfxSetTextColor( ParamColor("Color",colorYellow) );
//Hor=Param("Horizontal Position",800,800,800,800);

Hor=Param("Horizontal Position",20,20,500,20);


Ver=Param("Vertical Position",50,50,250,50);
GfxTextOut(""+C,Hor , Ver );
YC=TimeFrameGetPrice("C",inDaily,-1);
DD=Prec(C-YC,2);
xx=Prec((DD/YC)*100,2);
GfxSelectFont("Arial", 12, 700, italic = False, underline = False, True );
GfxSetBkMode( colorWhite );
GfxSetTextColor(ParamColor("Color",colorYellow) );
GfxTextOut(""+DD+" ("+xx+"%)", Hor+5, Ver+45 );
_SECTION_END();


_SECTION_BEGIN("Price Line");


PriceLevel = ParamField("PriceField", field = 3 );

Daysback = Param("Bars Back",100,10,500,1);
FirstBar = BarCount - DaysBack;
YY = IIf(BarIndex() >= Firstbar,EndValue(PriceLevel),Null);


side = Param("side",1,0,1000,1);

dist = 0;

for( i = 0; i < BarCount; i++ )
{
if(i+side== BarCount) PlotText( "\n " + PriceLevel[ i ], i, YY[ i ]-dist[i], colorLightBlue );
}


_SECTION_END();

_SECTION_BEGIN("Price1");
SetChartOptions(0,chartShowArrows|chartShowDates);
_N(Title = StrFormat("{{NAME}} - {{INTERVAL}} {{DATE}} Open %g, Hi %g, Lo %g, Close %g (%.1f%%) {{VALUES}}", O, H, L, C, SelectedValue( ROC( C, 1 ) ) ));
//Plot( C, "Close", ParamColor("Color", colorBlack ), styleNoTitle | ParamStyle("Style") | GetPriceStyle() );
_SECTION_END();


//HA Histogram//

_SECTION_BEGIN("Heiken Ashi Smoothed");
SetChartBkGradientFill( ParamColor("BgTop", colorBlack),ParamColor("BgBottom", colorBlack),ParamColor("Titleblock",colorBlack ));
SetChartOptions(0,chartShowArrows|chartShowDates);
GraphXSpace=5;
p=Param("Period",6,2,30,1);
Om=MA(O,p);
hm=MA(H,p);
lm=MA(L,p);
Cm=MA(C,p);
HACLOSE=(Om+Hm+Lm+Cm)/4;
HaOpen = AMA( Ref( HaClose, -1 ), 0.5 );
HaHigh = Max( Hm, Max( HaClose, HaOpen ) );
HaLow = Min( Lm, Min( HaClose, HaOpen ) );
_SECTION_END();


Histo1 = HACLOSE-HaOpen;
HistoEMA = EMA (Histo1,3);
Plot( Histo1, "HA Histogram", ParamColor("Histogram color", colorGreen ), styleNoTitle | ParamStyle("Histogram style", styleHistogram | styleNoLabel, maskHistogram ) );
Plot (HistoEMA, "EMA", colorRed, styleLine, 0,0,0,0);
3 comments
Leave Comment
Please login here to leave a comment.
Back
Thanks a lot, one question, does it look into future?
Because Amibroker code check says it does but ref functions are used with -1 parameter which references last bar.
from what i understand on Heiken Ashi it cannot, since the candles are based on the previous one. plus the formula are just bits and piece of other formulas (MACD and Heiken) which i modified. but I’m no expert.
if you could modify it to look into the future, feel free.
great sharing thank you bro////