Stock Portfolio Organizer
The ultimate porfolio management solution.
Shares, Margin, CFD's, Futures and Forex
EOD and Realtime
Dividends and Trust Distributions
And Much More ....
WiseTrader Toolbox
#1 Selling Amibroker Plugin featuring:
Advanced Adaptive Indicators
Advanced Pattern Exploration
Neural Networks
And Much More ....
ULTIMATE VOLATILITY EXPERT for Amibroker (AFL)
Rating:
3 / 5 (Votes 5)
Tags:
trading system, amibroker
hi friends,
trade only 5min time frame chart.
this afl code consept based by ULTIMATE VOLATILITY TRADING SYSTEM,
STRATEGY:
ENTRY:
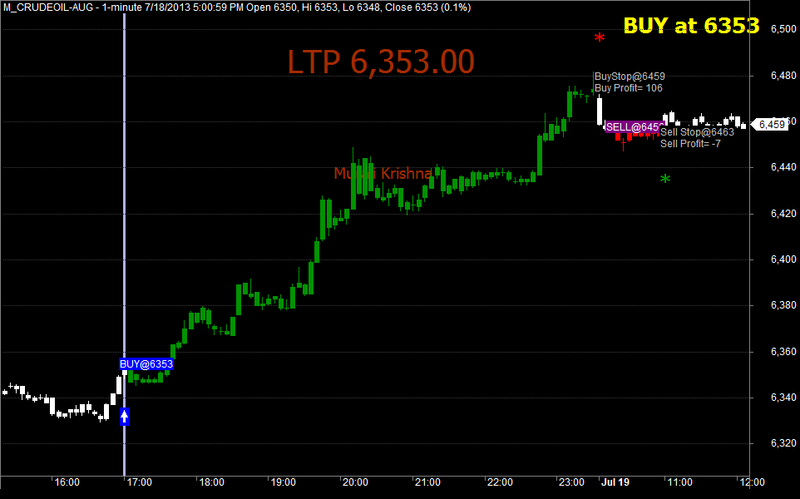
- buy or sell clearly indicates up and down arrows with Text.
EXIT: “Buy Stop” and “Sell Stop” indicators using for Target and Stop Loss
- when Long Trade exit indicates red star with text " Buy Stop", or market closing hours.
- when Short Trade exit indicates green star with text " Sell Stop" or market closing hours.
every trade profit or loss also indicates by text with the trade exit point.
regards,
Murali Krishna
Screenshots
Similar Indicators / Formulas
EMA crossover
Submitted
by Ketan-0 about 13 years ago
Kase Peak Osc. V2 batu
Submitted
by batu1453 almost 10 years ago
Kase CD V2batu
Submitted
by batu1453 almost 10 years ago
Ichimoku
Submitted
by prashantrdx almost 10 years ago
buy and sell two EMAS
Submitted
by mundo0007 about 12 years ago
Adaptive Price Zone (APZ)
Submitted
by AndrewThomas about 13 years ago
Indicator / Formula
Copy & Paste Friendly
_SECTION_BEGIN("Price");

SetBarsRequired(100000,0);
GraphXSpace = 15;
SetChartOptions(0,chartShowArrows|chartShowDates);
SetChartBkColor(ParamColor("bkcolor",ColorRGB(0,0, 0)));
GfxSetBkMode(0);
GfxSetOverlayMode(1);
//SetTradeDelays(1,1,1,1);
SetPositionSize(100,spsShares);

_N(Title = StrFormat("{{NAME}} - {{INTERVAL}} {{DATE}} Open %g, Hi %g, Lo %g, Close %g (%.1f%%) {{VALUES}}", O, H, L, C, SelectedValue( ROC( C, 1 ) ) ));

_SECTION_END();
NHours=Param("Number of Hours",30,1,50,1);
HoursC=TimeFrameGetPrice("O",inHourly,0);
NHoursDHLAvg=0;
for(i=1;i<=NHours;i++)
{
	HourH=TimeFrameGetPrice("H",inHourly,-i);
	HourL=TimeFrameGetPrice("L",inHourly,-i);
	NHoursDHLAvg=NHoursDHLAvg+(HourH-HourL);
}
NHoursDHLAvg=NHoursDHLAvg/NHours;

TenDHLAvg= NHoursDHLAvg;

Buy= C>((HoursC)+((0.618)*(TenDHLAvg)));
Sell= C<((HoursC)-((0.618)*(TenDHLAvg)));

Cover= C>((HoursC)+((0.382)*(TenDHLAvg)));
Short= C<((HoursC)-((0.382)*(TenDHLAvg)));

Buy=ExRem(Buy,Short);
Short=ExRem(Short,Buy);
Sell=ExRem(Sell,Cover);
Cover=ExRem(Cover,Sell);

BuyPrice=ValueWhen(Buy,C);
SellPrice=ValueWhen(Sell,C);
ShortPrice=ValueWhen(Short,C);
CoverPrice=ValueWhen(Cover,C);

PlotShapes(IIf(Buy, shapeSquare, shapeNone),colorBlue, 0, L, Offset=-40);
PlotShapes(IIf(Buy, shapeSquare, shapeNone),colorBlue, 0,L, Offset=-50);
PlotShapes(IIf(Buy, shapeUpArrow, shapeNone),colorWhite, 0,L, Offset=-45);
PlotShapes(IIf(Short, shapeStar, shapeNone),colorRed, 0, H, Offset=60);
PlotShapes(IIf(Sell, shapeSquare, shapeNone),colorDarkRed, 0,H, Offset=40);
PlotShapes(IIf(Sell, shapeSquare, shapeNone),colorDarkRed, 0,H, Offset=50);
PlotShapes(IIf(Sell, shapeDownArrow, shapeNone),colorWhite, 0,H, Offset=-45);
PlotShapes(IIf(Cover, shapeStar, shapeNone),colorGreen, 0,L, Offset=-60);
SetPositionSize(300,spsShares);

ApplyStop(0,1,10,1);
//-----------end--------------
Long=Flip(Buy,Short);
Shrt=Flip(Sell,Cover);

Edc=(
WriteIf (Buy , " BUY at "+C+"  ","")+
WriteIf (Sell, " SEll at "+C+"  ","")+
WriteIf (Cover , " Sell Stop at "+C+"  ","")+
WriteIf (Short , " Buy Stop at "+C+"  ","")
);
_SECTION_END();

BarColors =
IIf(BarsSince(Buy) < BarsSince(Short)
AND BarsSince(Buy)!=0, colorGreen,
IIf(BarsSince(Sell) < BarsSince(Cover)
AND BarsSince(Sell)!=0,  colorRed, colorWhite));

//Plot the Candlestick charts
Plot(C, "Close", BarColors,  styleNoTitle | ParamStyle("Style") | GetPriceStyle() ) ;

for( i = 0; i < BarCount; i++ )
  {
  if( Buy[i] ) PlotText( "BUY@" + C[ i ], i, C[ i ], colorWhite, colorBlue );
  if( Sell[i] ) PlotText( "SELL@" + C[ i ], i, C[ i ], colorWhite, colorViolet );
  if( Cover[i] ) PlotText( "Sell Stop@" + C[ i ]+ "\nSell Profit= " + ((SellPrice[i]-CoverPrice[i])), i, L[ i ]-3, colorLightGrey, colorBlack );
  if( Short[i] ) PlotText( "BuyStop@" + C[ i ]+ "\nBuy Profit= " + ((ShortPrice[i]-BuyPrice[i])), i, H[ i ]+3, colorLightGrey, colorBlack );

}

_SECTION_BEGIN("Background text");
C11=ParamColor("up panel",colorBlack );
C12=ParamColor("dn panel",colorBlack );
C13=Param("fonts",20,10,30,1 );
C14=Param("left-right",2.1,1.0,5.0,0.1 );
C15=Param("up-down",12,1,20,1 );
Miny = Status("axisminy");
Maxy = Status("axismaxy");
lvb = Status("lastvisiblebar");
fvb = Status("firstvisiblebar");
pxwidth = Status("pxwidth");
pxheight = Status("pxheight");
GfxSetBkMode( 0 );
GfxSetOverlayMode(1);
GfxGradientRect(0,0,pxwidth, pxheight, C11, C12 );
GfxSelectFont("Tahoma", Status("pxheight")/C13 );
GfxSetTextColor(colorBrown);
GfxSetTextAlign( 6 );
GfxTextOut( "LTP "+WriteVal(C,1.2), Status("pxwidth")/C14, Status("pxheight")/C15);
GfxSelectFont("Tahoma", Status("pxheight")/C13*0.5 );
GfxSetTextColor(colorBrown);
GfxTextOut( " Murali Krishna", Status("pxwidth")/C14, Status("pxheight")/C15*4 );
GfxSelectFont("Tahoma", 20, 800, False, False, 0);
GfxSetTextColor(colorYellow);
GfxTextOut(""+edc+"", Status("pxwidth")/1.15, Status("pxheight")/C15*0.3 );
2 comments
Leave Comment
Please login here to leave a comment.
Back
This AFL is good but for Bank Nifty, there is only 200 points profit after all positive and negative trades during expiry of August 2013 so far. So need some modification I guess. Thanks!
Hello Murali Krishna
This AFL also need trailing stop loss line,
Thanks