Stock Portfolio Organizer
The ultimate porfolio management solution.
Shares, Margin, CFD's, Futures and Forex
EOD and Realtime
Dividends and Trust Distributions
And Much More ....
WiseTrader Toolbox
#1 Selling Amibroker Plugin featuring:
Advanced Adaptive Indicators
Advanced Pattern Exploration
Neural Networks
And Much More ....
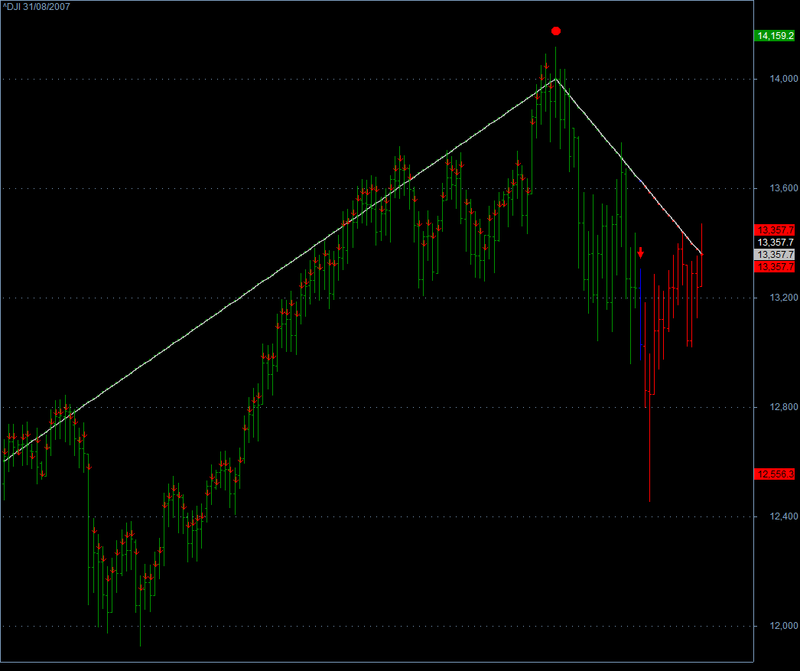
Zig Zag Pivot Scan for Amibroker (AFL)
Rating:
5 / 5 (Votes 4)
Tags:
amibroker, exploration, zigzag
This is the Zig Zag pivot scan exploration.
Screenshots
Similar Indicators / Formulas
GapUp and Bearish Close (Reversal) _Daily
Submitted
by indraji2001 almost 10 years ago
GapDn and Bullish Close (Reversal) _ Daily_Explore
Submitted
by indraji2001 almost 10 years ago
Three Day Balance Points
Submitted
by nvkha almost 10 years ago
Deel - Average Dollar Price Volatility
Submitted
by kaiji over 14 years ago
GAPexploration
Submitted
by bob303 almost 12 years ago
eod explorer
Submitted
by nishant551988 almost 12 years ago
Indicator / Formula
Copy & Paste Friendly
_SECTION_BEGIN("zigzagpivotscan");
//z_ZigZagValid
// ******** CHARTING
PercentChange = 6;
mystartbar = SelectedValue(BarIndex());  // FOR GRAPHING

mystartbardate = LastValue(ValueWhen(mystartbar == BarIndex(), DateNum(),1));

InitialValue = LastValue(ValueWhen(mystartbardate == DateNum(), C , 1 ) ) ;
Temp1 = IIf(BarIndex() >= mystartbar, InitialValue, Null) ;
Plot(Temp1, " ", colorBlack,styleLine);
Plot((1+(LastValue(PercentChange)/100))*(Temp1), " ", colorGreen, styleLine) ;
Plot((1-(LastValue(PercentChange)/100))*(Temp1), " ", colorRed, styleLine) ;

ZZ = Zig(C,LastValue(PercentChange)) ;
PivotLow = Ref(IIf(Ref(ROC(ZZ,1),-1) < 0 AND ROC(ZZ,1) > 0, 1, Null),1);
PivotHigh = Ref(IIf(Ref(ROC(ZZ,1),-1) > 0 AND ROC(ZZ,1) < 0, 1, Null),1);

PlotShapes( shapeCircle*PivotLow, colorGreen,0, L, -20) ;
PlotShapes( shapeCircle*PivotHigh,colorRed,0,H, 20) ;

Buy = IIf(C>(1+(LastValue(PercentChange)/100))*(ValueWhen(PivotLow, C, 1))
AND ROC(ZZ,1) > 0,1,0);
Sell = IIf(C<(1-(LastValue(PercentChange)/100))*(ValueWhen(PivotHigh, C, 1))
AND ROC(ZZ,1) < 0,1,0);

Buy = ExRem(Buy,Sell);
Sell = ExRem(Sell,Buy);

PlotShapes( shapeUpArrow*Buy, colorGreen,0, L, -20);
PlotShapes( shapeDownArrow*Sell, colorRed,0,H, -20) ;

BarColors =
IIf(BarsSince(Buy) < BarsSince(Sell)
AND BarsSince(Buy)!=0, colorGreen,
IIf(BarsSince(Sell) < BarsSince(Buy)
AND BarsSince(Sell)!=0,  colorRed, colorBlue));

Plot(C, " ", BarColors,  styleBar ) ;
Plot(ZZ," ", colorLightGrey,styleLine|styleThick);
Plot(ZZ," ", BarColors,styleDots|styleNoLine);

Title = Name() + " " + Date() + WriteIf(PivotLow, " Up Pivot ","")+WriteIf(PivotHigh," Down Pivot ","")+ WriteIf(Buy, " Buy Point ", "") + WriteIf(Sell, " Sell Point ", "") ;

AlertIf(Buy,   "", "",1,1 );
AlertIf(Sell,  "", "",2,1 );
_SECTION_END();
3 comments
Leave Comment
Please login here to leave a comment.
Back
very good
looking to the future!
This is the best Zig Zag ever.
Pascal