Stock Portfolio Organizer
The ultimate porfolio management solution.
WiseTrader Toolbox
#1 Selling Amibroker Plugin featuring:
NIKAR for Amibroker (AFL)
It is a very very succeessfull to me CHECK and USE EVERY ONE.
Give here screenshot
Welcome Your value feedback
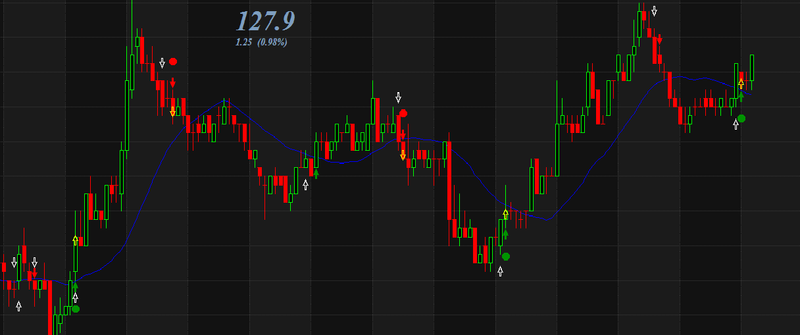
1) Buy Condition
First White signal//
Next Green circle and Green Arrow//
NOW YOU ‘BUY’ YELLOW ARROW //
STOPLOSS green circle (or) Last five Candle Which is Low//
TARGET buy value*0.5% Or your OWN RISK or (NEXT OPPOSITE YELLOW arrow MUST EXIT)
==================
2)SELL Condition
First White signal//
Next RED circle and RED Arrow//
NOW YOU ‘BUY’ YELLOW ARROW//
STOPLOSS red circle (or) Last five Candle Which is Low //
TARGET buy value*0.5% Or your OWN RISK or (NEXT OPPOSITE YELLOW arrow MUST EXIT)
==================
Screenshots
Similar Indicators / Formulas
Indicator / Formula
_SECTION_BEGIN("Price");
SetChartOptions(0,chartShowArrows|chartShowDates);
_N(Title = StrFormat("{{NAME}} - {{INTERVAL}} {{DATE}} Open %g, Hi %g, Lo %g, Close %g (%.1f%%) {{VALUES}}", O, H, L, C, SelectedValue( ROC( C, 1 ) ) ));
Plot( C, "Close", ParamColor("Color", colorDefault ), styleNoTitle | ParamStyle("Style") | GetPriceStyle() );
_SECTION_END();

_SECTION_BEGIN("MA1");
P = ParamField("Price field",-1);
Periods = Param("Periods", 10, 2, 300, 1, 10 );
Plot( MA( P, Periods ), _DEFAULT_NAME(), ParamColor( "Color", colorBlue ), ParamStyle("Style") );
_SECTION_END();

_SECTION_BEGIN("Arrow Detection tm");


Buy= Cross(MACD(05,30),Signal(05,30,10));
Sell = Cross( Signal(05,30,10), MACD(05,30) );


PlotShapes(IIf(Buy, shapeHollowUpArrow,shapeNone) ,colorWhite,0, Low, Offset=-25) ;
PlotShapes(IIf(Sell, shapeHollowDownArrow,shapeNone),colorWhite,0, High, Offset=-25) ;

_SECTION_END();


_SECTION_BEGIN("MACD Exploration");
r1 = Param( "Fast avg", 12, 2, 200, 1 );
r2 = Param( "Slow avg", 26, 2, 200, 1 );
r3 = Param( "Signal avg", 9, 2, 200, 1 );
Z=Param("zig",1,0,10,0.1);


Cond1 = Cross(MACD(r1,r2),Signal(r1,r2,r3));

Cond3 = Zig(C,z)>Ref(Zig(C,z),-4);
Buy = Cond1 AND Cond3;

Cond4 = Cross(Signal(r1,r2,r3),MACD(r1,r2));

Cond6 = Zig(C,z)<Ref(Zig(C,z),-4);
Sell = Cond4 AND Cond6;
Trigger = WriteIf(Buy, "Buy", "") + WriteIf(Sell, "Sell", "");

_SECTION_BEGIN("ZIG-ZAG");
P = ParamField( "Price field" );
change = Param("% change",5,0.1,25,0.1);
_SECTION_END();

_SECTION_BEGIN("EMA");
P = ParamField("Price field",-1);
Periods = Param("Periods", 15, 2, 300, 1, 10 );
_SECTION_END();

_SECTION_BEGIN("MACD Exploration");
r1 = Param( "Fast avg", 12, 2, 200, 1 );
r2 = Param( "Slow avg", 26, 2, 200, 1 );
r3 = Param( "Signal avg", 9, 2, 200, 1 );
Z=Param("zig",1,0,10,0.1);


Cond1 = Cross(MACD(r1,r2),Signal(r1,r2,r3));

Cond3 = Zig(C,z)>Ref(Zig(C,z),-4);
Buy = Cond1 AND Cond3;

Cond4 = Cross(Signal(r1,r2,r3),MACD(r1,r2));

Cond6 = Zig(C,z)<Ref(Zig(C,z),-4);
Sell = Cond4 AND Cond6;
Trigger = WriteIf(Buy, "Buy", "") + WriteIf(Sell, "Sell", "");

_N(Title = StrFormat("{{NAME}} {{DATE}} {{INTERVAL}}: O=%1.2f, H=%1.2f, L=%1.2f, C=%1.2f, V=%1.0f\n{{VALUES}}", O, H, L, C, V));

BG = IIf(Buy, colorPaleGreen, IIf(Sell, colorRose, colorDefault));
FG = IIf(Buy, colorDarkGreen, IIf(Sell, colorDarkRed, colorDefault));

if(Status("action") == actionIndicator)
{
Plot(C, "", colorGrey50, styleBar);
PlotShapes(IIf(Buy, shapeCircle, shapeNone),colorGreen, 0,L, Offset=-40);
PlotShapes(IIf(Sell, shapeCircle, shapeNone),colorRed, 0,H, Offset=40);
PlotShapes(shapeHollowDownArrow*Sell,colorYellow,0,SellPrice,-05);
PlotShapes(shapeHollowUpArrow*Buy,colorYellow,0,BuyPrice,-05);

}

_SECTION_BEGIN("Arrow Detection");

Buy= Cross(MACD(12,26),Signal(12,26,9));
Sell = Cross( Signal(12, 26, 9), MACD(12,26) );

PlotShapes(IIf(Buy, shapeUpArrow,shapeNone) ,colorGreen,0, Low, Offset=-10) ;
PlotShapes(IIf(Sell, shapeDownArrow,shapeNone),colorRed,0, High, Offset=-10) ;

_SECTION_END();

_SECTION_BEGIN("Live Market Price");
FS=Param("Font Size",30,11,100,1);
GfxSelectFont("Times New Roman", FS, 700, True );
GfxSetBkMode( colorWhite );
GfxSetTextColor( ParamColor("Color",colorLightBlue) );
Hor=Param("Horizontal Position",373,1,1200,1);
Ver=Param("Vertical Position",45,1,830,1);
GfxTextOut(""+C, Hor , Ver );
YC=TimeFrameGetPrice("C",inDaily,-1);
DD=Prec(C-YC,2);
xx=Prec((DD/YC)*100,2);
GfxSelectFont("Times New Roman", 11, 700, True );
GfxSetBkMode( colorWhite );
GfxSetTextColor(ParamColor("Color",colorBlack) );
GfxTextOut(""+DD+"  ("+xx+"%)", Hor , Ver+45 );

_SECTION_END();
15 comments
Leave Comment
Please login here to leave a comment.
Back
It is Winning formula to me.
which time frame works best on this afl? please suggest.
i just tested it for bank nifty future starting from september 11, 2013 for 15 minute time frame and it gives 2297 points. for other time frame it doesn’t give such a great return. thanks for sharing tmurthy.
Tmurthy,
Your formula appeared most interesting so I added and “Exploration” (below0 and it seems to work Okay. I’m not sure is got the “Buys/Sells identified properly so would be most appreciative if you would confirm. I couldn’t put full formula here so only Buy/Sellls shown
Dick H
i think part of the formula here, looks into future.i am talking about the red circle part. see the following pics.in first pic, u cant see the red circle but when price has advanced,the red circle appeared in the second pic.i also find lots of vanishing acts by the red circle :)
http://tinypic.com/view.php?pic=wjt56w&s=5
(see the pic zoomed area in pink.u cant see the red circle here)
http://tinypic.com/view.php?pic=ekkl0p&s=5
(see the pic zoomed area in pink.u can see the red circle has appeared)
the author can correct me if i am wrong :)
(CLICK ON THE PICTURE TO ZOOM THE SAME)
Yes Mr.Murthy as Naresh Said in some cases the formula looks into future. If u rectify those then it will be nice one. So kindly note it this…
it is because of Zig & Ref Function……!
this both function looks in future……!
and get vanished …..!
MR Murthy, thanks for posting this formulae here.. may i know which stocks u trade with this AFL & in what time frame.. do i need to consider to buy or sell above or below the avg moving line. reply me pls.. thanks once again for the formulae..
murthy sir its realy a good afl . but only problem is how to create that dot without vanish . pls make a little change for this . or can any one modify for clear that dot version without vanished . pls . hoierman can u pls update ur full modify version . thanks
this is repainting afl, is there an updated one
we can take a decision even if the dot vanishes as the white signal does not. so if green arrow and white arrow then also buy will work. good for scalping
sorry about my previous comment where i say, we can trade according to both only green and white arrows too. i backtested and found out it gives too many false signals
simply say superb good gain on 15min time frame for any sector
for jobbing 1min time frame for 1-2 points in fno with 1-2 sl
great afl
Nice AFL, THANKS
its repainting red DOT PLEASE FIX IT NON REPAINTING PLEASE