Stock Portfolio Organizer
The ultimate porfolio management solution.
Shares, Margin, CFD's, Futures and Forex
EOD and Realtime
Dividends and Trust Distributions
And Much More ....
WiseTrader Toolbox
#1 Selling Amibroker Plugin featuring:
Advanced Adaptive Indicators
Advanced Pattern Exploration
Neural Networks
And Much More ....
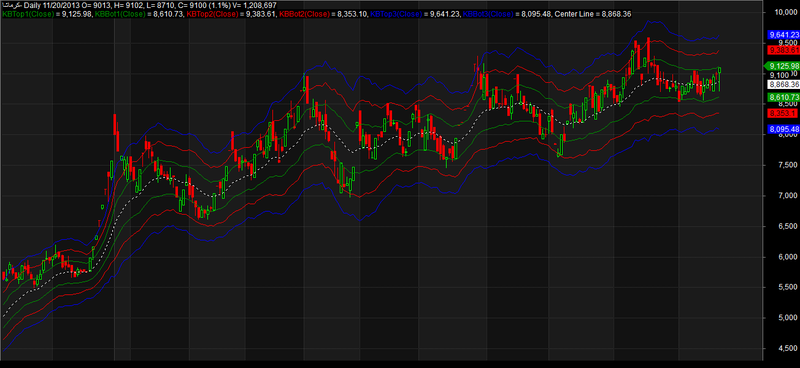
Keltner Bands for Amibroker (AFL)
Rating:
4 / 5 (Votes 4)
Tags:
amibroker, bands
Keltner Bands, 20-Days Period, ATR, Multiplier 1, 2 and 3
Screenshots
Similar Indicators / Formulas
Bollinger - Keltner Bands
Submitted
by kaiji over 14 years ago
Trend Bands
Submitted
by rogercraft about 14 years ago
Bollinger %B
Submitted
by konidena about 14 years ago
Bollinger Band Squeeze & Expansion
Submitted
by razasia about 14 years ago
Jurik's Spandex Band
Submitted
by xavier over 12 years ago
Indicator / Formula
Copy & Paste Friendly
// Keltner Bands, Version 1.0 //
// Developed By: Iraj Kaveh, iraj_kaveh@yahoo.com //

_SECTION_BEGIN("Keltner Bands");
P = ParamField("Price field",-1);
Style = ParamStyle("Style", styleLine );
CenterLine = EMA( P, 20 );
KTop1   = CenterLine + 1 * ATR( 10 );
KBot1 = CenterLine - 1 * ATR( 10 );

KTop2   = CenterLine + 2 * ATR( 10 );
KBot2 = CenterLine - 2 * ATR( 10 );

KTop3   = CenterLine + 3 * ATR( 10 );
KBot3 = CenterLine - 3 * ATR( 10 );

Plot( KTop1, "KBTop1" + _PARAM_VALUES(), colorGreen, Style );
Plot( KBot1, "KBBot1" + _PARAM_VALUES(), colorGreen, Style );

Plot( KTop2, "KBTop2" + _PARAM_VALUES(), colorRed, Style );
Plot( KBot2, "KBBot2" + _PARAM_VALUES(), colorRed, Style );

Plot( KTop3, "KBTop3" + _PARAM_VALUES(), colorBlue, Style );
Plot( KBot3, "KBBot3" + _PARAM_VALUES(), colorBlue, Style );

Plot( CenterLine, "Center Line", colorWhite, styleLine | styleDashed );
_SECTION_END();

_SECTION_BEGIN("Price Chart");
_N(Title = StrFormat("{{NAME}}- {{INTERVAL}} {{DATE}} O= %g, H= %g, L= %g, C= %g (%.1f%%) V= " +WriteVal( V, 1.0 ) +"\n{{VALUES}}", O, H, L, C, SelectedValue(ROC( C, 1 )) ));
PriceStyle = GetPriceStyle();
PriceStyleOpt = ParamStyle("Price Style")|PriceStyle;

if (PriceStyle==styleCandle)
   Plot( C, "", colorBlack,  PriceStyleOpt);
else
   Plot( C, "", IIf( Close >= Ref(C, -1), colorGreen, colorRed ), PriceStyleOpt);
_SECTION_END();
1 comments
Leave Comment
Please login here to leave a comment.
Back
looks similar to MBFX system in Metatrader