Stock Portfolio Organizer
The ultimate porfolio management solution.
Shares, Margin, CFD's, Futures and Forex
EOD and Realtime
Dividends and Trust Distributions
And Much More ....
WiseTrader Toolbox
#1 Selling Amibroker Plugin featuring:
Advanced Adaptive Indicators
Advanced Pattern Exploration
Neural Networks
And Much More ....
Ultimate-volatility-trading-system-v-2a for Amibroker (AFL)
Rating:
3 / 5 (Votes 6)
Tags:
exploration, trading system, amibroker, advanced
this afl shared by murlikrishna and modified by me..thanx to murlikrishna and admin… good for intraday exploration…
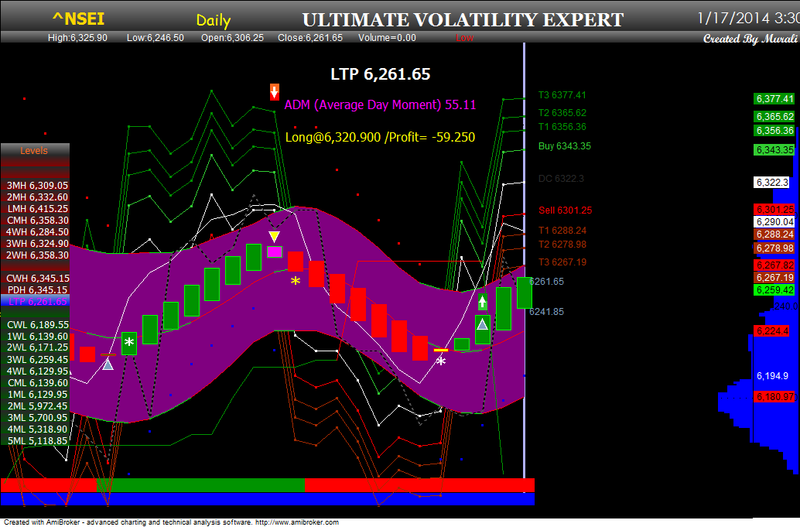
Screenshots
Similar Indicators / Formulas
Reaction Trend System
Submitted
by ajayjain90 almost 14 years ago
Range Constriction
Submitted
by davidh over 12 years ago
Ribbon Trading System
Submitted
by trader22 about 14 years ago
4 Days Down System
Submitted
by hoierman about 14 years ago
RAJASWAMY LONG TRADE
Submitted
by rajaswamy over 13 years ago
20 Day High Breakout
Submitted
by ashokram1 over 12 years ago
Indicator / Formula
Copy & Paste Friendly
_SECTION_BEGIN("Price");
PCa=TimeFrameGetPrice( "C", inDaily, -1 );
SetChartOptions(0,chartShowArrows|chartShowDates);
SetChartBkColor(ParamColor("bkcolor",ColorRGB(0,0, 0)));
//SetTradeDelays(1,1,1,1);
SetPositionSize(100,spsShares);
_SECTION_END();

NDays=Param("Number of Days",10,1,50,1);
DayC=TimeFrameGetPrice("C",inDaily,-1);
NDaysDHLAvg=0;
for(i=1;i<=NDays;i++)
{
	DayH=TimeFrameGetPrice("H",inDaily,-i);
	DayL=TimeFrameGetPrice("L",inDaily,-i);
	NDaysDHLAvg=NDaysDHLAvg+(DayH-DayL);
}
NDaysDHLAvg=NDaysDHLAvg/NDays;

ADM= NDaysDHLAvg;   // Average Day Moment

// Dynamic Levels//----------Majer Support Resistent Zones---------------------------------------------------

DayH = 	TimeFrameGetPrice("H", inDaily, -1);	   		DayHI = LastValue (DayH,1); 		// yesterdays high
DayL = 	TimeFrameGetPrice("L", inDaily, -1);	 		DayLI = LastValue (DayL,1);			// yesterdays low
DayC = 	TimeFrameGetPrice("C", inDaily, -1);	 		DayCI = LastValue (DayC,1);			// yesterdays close
DayO = 	TimeFrameGetPrice("O", inDaily);				DayOI = LastValue (DayO,1);			// current day open
WeekH= 	TimeFrameGetPrice("H", inWeekly, 0);     		WeekHI = LastValue (WeekH,1); 		// This Week  high
WeekL= 	TimeFrameGetPrice("L", inWeekly, 0);     		WeekLI = LastValue (WeekL,1); 		// This Week  low
MonthH= 	TimeFrameGetPrice("H", inMonthly, 0);   		MonthHI = LastValue (MonthH,1); 	// This Month  high
MonthL= 	TimeFrameGetPrice("L", inMonthly, 0);  		MonthLI = LastValue (MonthL,1); 	// This Month  low
LWeekH= 	TimeFrameGetPrice("H", inWeekly, -1);   		LWeekHI = LastValue (LWeekH,1);  	// One Week before high
LWeekL= 	TimeFrameGetPrice("L", inWeekly, -1);   		LWeekLI = LastValue (LWeekL,1);  	// One Week before low
LMonthH= 	TimeFrameGetPrice("H", inMonthly, -1); 		LMonthHI = LastValue (LMonthH,1); 	// One Month before high
LMonthL= 	TimeFrameGetPrice("L", inMonthly, -1); 		LMonthLI = LastValue (LMonthL,1); 	// One Month before low
L1WeekH= 	TimeFrameGetPrice("H", inWeekly, -2);  		L1WeekHI = LastValue (L1WeekH,1); 	// Two Week before high
L1WeekL= 	TimeFrameGetPrice("L", inWeekly, -2);  		L1WeekLI = LastValue (L1WeekL,1); 	// Two Week before low
L1MonthH= 	TimeFrameGetPrice("H", inMonthly, -2);		L1MonthHI = LastValue (L1MonthH,1);	// Two Month before high
L1MonthL= 	TimeFrameGetPrice("L", inMonthly, -2); 		L1MonthLI = LastValue (L1MonthL,1);	// Two Month before low
L2WeekH= 	TimeFrameGetPrice("H", inWeekly, -3);   		L2WeekHI = LastValue (L2WeekH,1);  	// Three Week before high
L2WeekL= 	TimeFrameGetPrice("L", inWeekly, -3);   		L2WeekLI = LastValue (L2WeekL,1);  	// Three Week before low
L2MonthH= 	TimeFrameGetPrice("H", inMonthly, -3); 		L2MonthHI = LastValue (L2MonthH,1);	// Three Month before high
L2MonthL= 	TimeFrameGetPrice("L", inMonthly, -3); 		L2MonthLI = LastValue (L2MonthL,1);  	// Three Month before low
L3MonthH= 	TimeFrameGetPrice("H", inMonthly, -4); 		L3MonthHI = LastValue (L3MonthH,1);  	// Four Month before high
L3MonthL= 	TimeFrameGetPrice("L", inMonthly, -4);  		L3MonthLI = LastValue (L3MonthL,1); 	// Four Month before low
L4MonthH= 	TimeFrameGetPrice("H", inMonthly, -5);  		L4MonthHI = LastValue (L4MonthH,1); 	// Five Month before high
L4MonthL= 	TimeFrameGetPrice("L", inMonthly, -5);  		L4MonthLI = LastValue (L4MonthL,1); 	// Five Month before low
L3WeekH= 	TimeFrameGetPrice("H", inWeekly, -4);    		L3WeekHI = LastValue (L3WeekH,1); 	// Four Week before high
L3WeekL= 	TimeFrameGetPrice("L", inWeekly, -4);   		L3WeekLI = LastValue (L3WeekL,1); 	// Four Week before low
//----------------------------------------------------------------------------------------------------------------------
sigwd=ParamToggle("sigchange","weekly|daily",1);
//HBS mean histogram buy sell and LHBS mean low buy high sell
field= ParamToggle("field","fieldd|fieldw",1);
font = ParamToggle("font","Show|Hide",1);
messageboard = ParamToggle("Message Board","Show|Hide",0);
prexplore= ParamToggle("perce/buysell","pers|buysell",1);

plus= Param("plus", 1,0,52,1);
Minus = Param("Minus", -1,-15,-0,-20);
prch = (C- TimeFrameGetPrice( "C", inDaily, -1 ))/ TimeFrameGetPrice( "C", inDaily, -1 )*100 ;

col=IIf ((Volume > 1.25 * EMA( Volume, 34 )),colorRed,colorLime);
Filter = prch > plus OR prch  < Minus  ;

Buy=Cover=Cross(C,pca) AND prch>plus;//(btp3,aa);
Sell=Short=Cross(pca,C)AND prch<Minus;//(aa,stp3);
//Buy=Cover=Cross(C,Ref(L,-1)) AND prch>plus;//(btp3,aa);
//Sell=Short=Cross(Ref(H,-1),C)AND prch<Minus;//(aa,stp3);
AddColumn(prch,"daily", 1.2,colorDefault, Col);
_SECTION_BEGIN("Flower");
Show_color = ParamToggle("Display CandleColor", "No|Yes", 1);
r1 = Param( "ColorFast avg", 5, 2, 200, 1 );
r2 = Param( "ColorSlow avg", 10, 2, 200, 1 );
r3 = Param( "ColorSignal avg", 5, 2, 200, 1 );

Prd1=Param("ATR Period",4,1,20,1);
Prd2=Param("Look Back",7,1,20,1);
green = HHV(LLV(L,Prd1)+ATR(Prd1),Prd2);
red = LLV(HHV(H,Prd1)-ATR(Prd1),Prd2);
flowerClose = EMA((Open+High+Low+Close)/4,3) ;
flowerOpen = EMA((Ref(Open,-1) + Ref(flowerClose,-1))/2,3);
Temp = Max(High, flowerOpen);
flowerHigh = EMA(Max(Temp, flowerClose),3);
Temp = Min(Low,flowerOpen);
flowerLow = EMA(Min(Temp, flowerClose),3);


m1=MACD(r1,r2);
s1=Signal(r1,r2,r3);
mycolor=IIf(m1<0 AND m1>s1, colorYellow,IIf(m1>0 AND m1>s1,colorGreen,IIf(m1>0 AND m1<s1,colorCustom12,colorRed)));
if(Show_color)
{
ColorHighliter = myColor;
SetBarFillColor( ColorHighliter );


}

barColor=IIf(C>Green ,colorBrightGreen,IIf(C < RED,colorRed,colorWhite));


//PlotOHLC( IIf(flowerOpen<flowerClose, flowerOpen, flowerClose),flowerHigh,flowerLow,IIf(flowerOpen<flowerClose, flowerClose, flowerOpen), "Close", barColor, styleNoTitle | styleCandle);


_SECTION_END();
py = Param("pc", 9, 0, 100,1 );
HaClose = (EMA(O,py)+EMA(H,py)+EMA(L,py)+EMA(C,py))/4;
HaOpen = AMA( Ref( HaClose, -1 ), 0.5 );
HaHigh = Max( H, Max( HaClose, HaOpen ) );
HaLow = Min( L, Min( HaClose, HaOpen ) );
xDiff = (HaHigh - Halow) * IIf(StrFind(Name(),"JPY"),100,10000);
barcolor = IIf(HaClose >= HaOpen,colorBrightGreen,colorRed);
PlotOHLC( HaOpen, Haopen, Haclose, HaClose, "", barcolor, styleCandle );
acc = Param("Acceleration", 0.150, 0, 1, 0.001 );
accm = Param("Max. acceleration", 0.1, 0, 1, 0.001 );
myColor = IIf (Avg > SAR( acc, accm ) , colorBlue , colorRed);
Plot( SAR( acc, accm ), _DEFAULT_NAME(), myColor , ParamStyle("Style", styleDots | styleNoLine, maskDefault | styleDots | styleNoLine ) );
Buy1=Cover2=Cross(Avg,SAR( acc, accm ));
Sell2=Short2=Cross(SAR( acc, accm ),Avg);
PlotShapes( Buy1 * shapeStar + Sell2 * shapeStar, IIf( Buy1, colorWhite, colorYellow ));
_SECTION_BEGIN("Price Line");
dp= Param("dps",3,0,1000,1);
PriceLineColor=ParamColor("PriceLineColor",ColorRGB(82,82,82));
PriceLevel = ParamField("PriceField", field = 3 );
PriceLeve2 = ParamField("PriceField", field = dp );
Daysback    = Param("Bars Back",1,10,500,1);
FirstBar    = BarCount - DaysBack;
YY          = IIf(BarIndex() >= Firstbar,EndValue(PriceLevel),Null);

Plot(YY,"Current Price",PriceLineColor,ParamStyle("LineStyle",styleLine|styleDashed|styleNoTitle|styleNoLabel|styleThick,maskAll));

PC=TimeFrameGetPrice( "C", inDaily, -3 );
Plot(pc,"Current Price",PriceLineColor,ParamStyle("LineStyle",styleLine|styleDashed|styleNoTitle|styleNoLabel|styleThick,maskAll));

side = Param("side",1,0,1000,1);

dist = 0;

for( i = 0; i < BarCount; i++ )
{
 if(i+side== BarCount) PlotText( "\n    " + PriceLevel[ i ], i, YY[ i ]-dist[i], colorLightBlue );
if(i+side== BarCount) PlotText( "\n    " + Pc[ i ], i, pc[ i ]-dist[i], colorLightBlue );
}


_SECTION_END();
_SECTION_BEGIN("Flower");
si=Param("Zoom/In Out",5,-50,100,1);
GraphXSpace=si;

r1 = Param( "ColorFast avg", 5, 2, 200, 1 );
r2 = Param( "ColorSlow avg", 10, 2, 200, 1 );
r3 = Param( "ColorSignal avg", 5, 2, 200, 1 );
 r4 = Param( " avg1", 12, 2, 200, 1 );
r5 = Param( " avg2", 12, 2, 200, 1 );
r6 = Param( " avg3", 12, 2, 200, 1 );
m1=MACD(r1,r2);
s1=Signal(r1,r2,r3);
mycolor=IIf(m1<0 AND m1>s1, ColorRGB(155,155,155),IIf(m1>0 AND m1>s1,ColorRGB(0,125,0),IIf(m1>0 AND m1<s1,ColorRGB(180,30,160),ColorRGB(100,0,0))));

Prd1=Param("ATR Period",4,1,20,1);
Prd2=Param("Look Back",7,1,20,1);
green = HHV(LLV(L,Prd1)+ATR(Prd1),Prd2);
red = LLV(HHV(H,Prd1)-ATR(Prd1),Prd2);
flowerClose = EMA((Open+High+Low+Close)/4,3) ;
flowerOpen = EMA((Ref(Open,-1) + Ref(flowerClose,-1))/2,3);
Temp = Max(High, flowerOpen);
flowerHigh = EMA(Max(Temp, flowerClose),3);
Temp = Min(Low,flowerOpen);
flowerLow = EMA(Min(Temp, flowerClose),3);


ad=WMA(flowerHigh,r4);
dr=WMA(flowerlow,r5);
sr=(ad+dr)/2;

flowerOpen = EMA((Ref(Open,-1) + Ref(flowerClose,-1))/2,3);
Temp = Max(High, flowerOpen);
flowerHigh = EMA(Max(Temp, flowerClose),3);
Temp = Min(Low,flowerOpen);
flowerLow = EMA(Min(Temp, flowerClose),3);
barColor=IIf(Close>Open,ColorRGB(0,245,0),ColorRGB(255,0,0));


total = 0;
for( i = 0; i < BarCount; i++ )
{

    if( total[i] >= 5 )
        Color[i] = colorLime;
    else if(  total[i] <= -5 )
        Color[i] = colorRed;
    else
        Color[i] = colorWhite;
}

Candle=ParamList("Candle","Modified Candlestick,Modified Heikin Ashi,Normal Candlestick",1);
if(Candle=="Modified Candlestick")
{
ColorHighliter = myColor;
SetBarFillColor( ColorHighliter );
Plot (Close,"- Modified Candlestick", Color,ParamStyle( "Style", styleCandle|styleLine | styleThick, maskAll));
PlotOHLC( IIf(flowerOpen<flowerClose, flowerOpen, flowerClose),flowerHigh,flowerLow,IIf(flowerOpen<flowerClose, flowerClose, flowerOpen), "Modified Heikin Ashi", Color, styleCandle);

}
if(Candle=="Modified Heikin Ashi")
{
CloudResColor=ParamColor("CloudResColor",colorTeal);

ColorHighliter = myColor;
SetBarFillColor( ColorHighliter );
PlotOHLC( IIf(flowerOpen<flowerClose, flowerOpen, flowerClose),flowerHigh,flowerLow,IIf(flowerOpen<flowerClose, flowerClose, flowerOpen), "Modified Heikin Ashi", color, styleLine|styleLine);


}
if(Candle=="Normal Candlestick")
{
//ColorHighliter = myColor;
//SetBarFillColor( ColorHighliter );
PlotOHLC(O,H,L,C,"Normal Candlestick",barcolor,styleCandle|styleLine);
}
sr1=(MA(flowerOpen,3)+MA(flowerClose,3))/2;
 ad=WMA(flowerHigh,12);
dr=WMA(flowerlow,12);
sr=(ad+dr)/2;
_SECTION_END();
Factor=Param("Factor",1.5,1,10,0.1);
Pd=Param("ATR Periods",3,1,100,1);
Up=(ad+dr)/2+(Factor*ATR(Pd));
Dn=(ad+dr)/2-(Factor*ATR(Pd));
iATR=ATR(Pd);
TrendUp=TrendDown=Null;
trend[0]=1;
changeOfTrend=0;
flag=flagh=0;

for (i = 1; i <BarCount-1; i++) {
      TrendUp[i] = Null;
      TrendDown[i] = Null;

      trend[i]=1;


      if (flowerClose[i]>Up[i-1]) {
         trend[i]=1;
         if (trend[i-1] == -1) changeOfTrend = 1;

      }
      else if (flowerClose[i]<Dn[i-1]) {
         trend[i]=-1;
         if (trend[i-1] == 1) changeOfTrend = 1;
      }
      else if (trend[i-1]==1) {
         trend[i]=1;
         changeOfTrend = 0;
      }
      else if (trend[i-1]==-1) {
         trend[i]=-1;
         changeOfTrend = 0;
      }

      if (trend[i]<0 && trend[i-1]>0) {
         flag=1;
      }
      else {
         flag=0;
      }

      if (trend[i]>0 && trend[i-1]<0) {
         flagh=1;
      }
      else {
         flagh=0;
      }

      if (trend[i]>0 && Dn[i]<Dn[i-1]){
         Dn[i]=Dn[i-1];
		}

      if (trend[i]<0 && Up[i]>Up[i-1])
        { Up[i]=Up[i-1];
		}

      if (flag==1)
       {  Up[i]=(H[i]+L[i])/2+(Factor*iATR[i]);;
        }
      if (flagh==1)
        { Dn[i]=(ad[i]+dr[i])/2-(Factor*iATR[i]);;
         }
      if (trend[i]==1) {
         TrendUp[i]=Dn[i];
         if (changeOfTrend == 1) {
            TrendUp[i-1] = TrendDown[i-1];
            changeOfTrend = 0;
         }
      }
      else if (trend[i]==-1) {
         TrendDown[i]=Up[i];
         if (changeOfTrend == 1) {
            TrendDown[i-1] = TrendUp[i-1];
            changeOfTrend = 0;
         }
      }
   }

Plot(TrendUp,"Trend",colorGreen);
Plot(TrendDown,"Down",colorRed);

Plot(ad-9,"Normal 1",barcolor,styleLine);
Plot(dr-9,"Normal 1",barcolor,styleLine);
Plot(sr-9,"Normal 1",barcolor,styleLine);
PlotOHLC( ad-9, ad-9, dr-9,dr-9, "Band", colorViolet, styleCloud | styleNoLabel|styleNoTitle);
sb=O+C+H+L/4;
   BTP3 = sb+H*1.035;
STP3 = sb+L*0.988;
//Plot(btp3,"Normal 1",barcolor,styleLine);
//Plot(stp3,"Normal 1",barcolor,styleLine);
sb=O+C+H+L/4;
   BTP3 = sb+H*0.5;
STP3 = sb+L*0.5;
STP4 = sb+C*0.5;
aa=EMA(stp4,4);
//PC=TimeFrameGetPrice( "C", inDaily, -1 )+L;
//PC1=TimeFrameGetPrice( "C", inDaily, -1 )+H;
//barColor=IIf(C>EMA(Avg,3) ,colorBrightGreen,IIf(C < EMA(Avg,3),colorRed,colorWhite));

//Plot(btp3,"Normal 1",barcolor,styleLine);
//Plot(stp3,"Normal 1",barcolor,styleLine);
//Plot(aa,"Normal 1",barcolor,styleLine);

PlotShapes(IIf(Buy,shapeUpArrow,shapeNone),colorGreen);
PlotShapes(IIf(Buy,shapeHollowUpArrow,shapeNone),colorWhite);
//PlotShapes(IIf(Buy,shapeHollowSmallCircle,shapeNone),colorWhite);

PlotShapes(IIf(Sell,shapeDownArrow,shapeNone),colorRed);
PlotShapes(IIf(Sell,shapeHollowDownArrow,shapeNone),colorWhite);
//PlotShapes(IIf(Sell,shapeHollowSmallCircle,shapeNone),colorWhite);

PlotShapes(IIf(Short,shapeDownTriangle,shapeNone),colorYellow);
PlotShapes(IIf(Short,shapeHollowDownTriangle,shapeNone),colorWhite);
//PlotShapes(IIf(Short,shapeHollowCircle,shapeNone),colorWhite);

PlotShapes(IIf(Cover,shapeUpTriangle,shapeNone),colorLightBlue);
PlotShapes(IIf(Cover,shapeHollowUpTriangle,shapeNone),colorWhite);
//Buy = trend==1;
//Sell=trend==-1;
//Buy = Cross(MA(Avg,4),sr1);
//Sell = Cross(sr1,MA(Avg,4));
Short = Sell;
Cover = Buy;
Buy = ExRem(Buy,Sell);
Sell = ExRem(Sell,Buy);
Short = ExRem(Short, Cover);
Cover = ExRem(Cover, Short);
AlertIf( Buy, "", "BUY @ " + C, 1 );
AlertIf( Sell, "", "SELL @ " + C, 2 );

//Buy= C>((DayC)+((.382)*(ADM)));
//Sell= C<((DayC)-((.382)*(ADM)));

Buy=ExRem(Buy,Sell);
Sell=ExRem(Sell,Buy);

Short=Sell;
Cover=Buy;

BuyPrice=ValueWhen(Buy,C);
SellPrice=ValueWhen(Sell,C);
ShortPrice=ValueWhen(Short,C);
CoverPrice=ValueWhen(Cover,C);

BuyTarget1= (0.45*ADM)+BuyPrice;
BuyTarget2= (0.95*ADM)+BuyPrice;
BuyTarget3= (1.95*ADM)+BuyPrice;
SellTarget1= SellPrice-(0.45*ADM);
SellTarget2= SellPrice-(0.95*ADM);
SellTarget3= SellPrice-(1.95*ADM);

//------------------------------------------------------------------------------------------------

PlotShapes(IIf(Buy, shapeSquare, shapeNone),colorGreen, 0, L, Offset=-40);
PlotShapes(IIf(Buy, shapeSquare, shapeNone),colorLime, 0,L, Offset=-50);
PlotShapes(IIf(Buy, shapeUpArrow, shapeNone),colorWhite, 0,L, Offset=-45);
PlotShapes(IIf(Short, shapeSquare, shapeNone),colorRed, 0, H, Offset=40);
PlotShapes(IIf(Short, shapeSquare, shapeNone),colorOrange, 0,H, Offset=50);
PlotShapes(IIf(Short, shapeDownArrow, shapeNone),colorWhite, 0,H, Offset=-45);

Long=Flip(Buy,Sell);
Shrt=Flip(Sell,Buy);

BuyPrice=ValueWhen(Buy,C);
SellPrice=ValueWhen(Sell,C);

Bdc=(
WriteIf (Buy AND Ref(shrt,-1), " BUY@ "+C+"  ","")+
WriteIf(Buy  , "LastTrade Profit="+(SellPrice-C)+"","")
);

Sdc=(
WriteIf (Sell AND Ref(Long,-1), " SEll@ "+C+"  ","")+
WriteIf(Sell , "LastTrade Profit="+(C-BuyPrice)+"","")
);

Ndc=(
WriteIf(Long AND NOT Buy, "Long@"+WriteVal((BuyPrice))+" /Profit="+WriteVal((C-BuyPrice))+"","")+
WriteIf(Shrt AND NOT Sell, "Short@"+WriteVal((SellPrice))+" /Profit="+WriteVal((SellPrice-C))+"","")
);

BTdc=(
WriteIf(Long AND NOT Buy, "Target1(1/2ADM)"+WriteVal((BuyTarget1))+
"::\nTarget2(One ADM)"+WriteVal((BuyTarget2))+
"::\nTarget3(Two ADM)"+WriteVal((BuyTarget3))+"","")
);

STdc=(
WriteIf(Shrt AND NOT Sell, "Target1(1/2ADM)"+WriteVal((SellTarget1))+
"::\nTarget2(One ADM)"+WriteVal((SellTarget2))+
"::\nTarget3(Two ADM)"+WriteVal((SellTarget3))+"","")
);

_SECTION_END();

trendup = IIf(C>((DayC)+((.382)*(ADM))), colorBlue, colorWhite);
trendcolor = IIf(C<((DayC)-((.382)*(ADM))), colorRed, trendup);
//Plot( C, "Close", trendcolor, styleCandle | styleThick );

numbars = LastValue(Cum(Status("barvisible")));
hts  = -33.5;

// Volatility Levels //
DC =    DayC;                               DCI = LastValue (DC,1);     // Yesterday Close
BY  =  ((DayC)+((.382)*(ADM)));       BYI = LastValue (BY,1);     // Buy Entry Line
BT1  =  ((DayC)+((.618)*(ADM)));      BT1I = LastValue (BT1,1);   // Buy Target Line 1
BT2  =  ((DayC)+((.786)*(ADM)));      BT2I = LastValue (BT2,1);   // Buy Target Line 2
BT3  =  ((DayC)+(ADM));               BT3I = LastValue (BT3,1);   // Buy Target Line 3
SH  =  ((DayC)-((.382)*(ADM)));       SHI = LastValue (SH,1);   // Sell Entry Line
ST1  =  ((DayC)-((.618)*(ADM)));      ST1I = LastValue (ST1,1);   // Sell Target Line 1
ST2  =  ((DayC)-((.786)*(ADM)));      ST2I = LastValue (ST2,1);   // Sell Target Line 2
ST3 =  ((DayC)-(ADM));                ST3I = LastValue (ST3,1);   // Sell Target Line 3

vvl = ParamToggle("Intraday Target Levels","Hide|Show",1);
if(vvl==1)  {
  Plot(DC, "DC",colorWhite,styleDots|styleLine|styleNoRescale|styleNoTitle);
  Plot(BY, "BY",colorLime,styleDots|styleLine|styleNoRescale|styleNoTitle);
  Plot(BT1, "BT1",colorGreen,styleDots|styleLine|styleNoRescale|styleNoTitle);
  Plot(BT2, "BT2",colorGreen,styleDots|styleLine|styleNoRescale|styleNoTitle);
  Plot(BT3, "BT3",colorGreen,styleDots|styleLine|styleNoRescale|styleNoTitle);
  Plot(SH, "SH",colorRed,styleDots|styleLine|styleNoRescale|styleNoTitle);
  Plot(ST1, "ST1",colorBrown,styleDots|styleLine|styleNoRescale|styleNoTitle);
  Plot(ST2, "ST2",colorBrown,styleDots|styleLine|styleNoRescale|styleNoTitle);
  Plot(ST3, "ST3",colorBrown,styleDots|styleLine|styleNoRescale|styleNoTitle);

  PlotText(" DC "+dci,  LastValue(BarIndex())-(numbars/Hts), DCI, colorDarkGrey);
  PlotText(" Buy "+byI ,    LastValue(BarIndex())-(numbars/Hts), BYI, colorLime);
  PlotText(" T1 " +bt1I,    LastValue(BarIndex())-(numbars/Hts), BT1I, colorGreen);
  PlotText(" T2 " +bt2I,    LastValue(BarIndex())-(numbars/Hts), BT2I, colorGreen);
  PlotText(" T3 "+bt3I ,    LastValue(BarIndex())-(numbars/Hts), BT3I, colorGreen);
  PlotText(" Sell " +shI,    LastValue(BarIndex())-(numbars/Hts), SHI, colorRed);
  PlotText(" T1 "+st1I ,    LastValue(BarIndex())-(numbars/Hts), ST1I, colorBrown);
  PlotText(" T2 "+st2I ,    LastValue(BarIndex())-(numbars/Hts), ST2I, colorBrown);
  PlotText(" T3 "+st3I ,    LastValue(BarIndex())-(numbars/Hts), ST3I, colorBrown);
}

mmwwl = ParamToggle(" MOnthly, Weekly Levels","Hide|Show",0);
if(mmwwl==1)  {
  Plot(DayH, "PDH",colorBlue,styleLine|styleNoRescale|styleNoTitle);
  Plot(WeekH, "CWH",colorBlue,styleLine|styleNoRescale|styleNoTitle);
  Plot(LWeekH, "LWH",colorBlue,styleLine|styleNoRescale|styleNoTitle);
  Plot(L1WeekH, "2WH",colorBlue,styleLine|styleNoRescale|styleNoTitle);
  Plot(L2WeekH, "3WH",colorBlue,styleLine|styleNoRescale|styleNoTitle);
  Plot(L3WeekH, "4WH",colorBlue,styleLine|styleNoRescale|styleNoTitle);
  Plot(MonthH, "CMH",colorBlue,styleLine|styleNoRescale|styleNoTitle);
  Plot(LMonthH, "LMH",colorBlue,styleLine|styleNoRescale|styleNoTitle);
  Plot(L1MonthH, "2MH",colorBlue,styleLine|styleNoRescale|styleNoTitle);
  Plot(L2MonthH, "3MH",colorBlue,styleLine|styleNoRescale|styleNoTitle);
  Plot(L3MonthH, "4MH",colorBlue,styleLine|styleNoRescale|styleNoTitle);
  Plot(L4MonthH, "5MH",colorBlue,styleLine|styleNoRescale|styleNoTitle);

  Plot(DayL, "PDL",colorViolet,styleLine|styleNoRescale|styleNoTitle);
  Plot(WeekL, "CWL",colorViolet,styleLine|styleNoRescale|styleNoTitle);
  Plot(LWeekL, "LWL",colorViolet,styleLine|styleNoRescale|styleNoTitle);
  Plot(L1WeekL, "2WL",colorViolet,styleLine|styleNoRescale|styleNoTitle);
  Plot(L2WeekL, "3WL",colorViolet,styleLine|styleNoRescale|styleNoTitle);
  Plot(L3WeekL, "4WL",colorViolet,styleLine|styleNoRescale|styleNoTitle);
  Plot(MonthL, "CML",colorViolet,styleLine|styleNoRescale|styleNoTitle);
  Plot(LMonthL, "LML",colorViolet,styleLine|styleNoRescale|styleNoTitle);
  Plot(L1MonthL, "2ML",colorViolet,styleLine|styleNoRescale|styleNoTitle);
  Plot(L2MonthL, "3ML",colorViolet,styleLine|styleNoRescale|styleNoTitle);
  Plot(L3MonthL, "4ML",colorViolet,styleLine|styleNoRescale|styleNoTitle);
  Plot(L4MonthL, "5ML",colorViolet,styleLine|styleNoRescale|styleNoTitle);

  PlotText(" PDH ",  	LastValue(BarIndex())-(numbars/Hts), DayHI, colorBlue);
  PlotText(" CWH " ,    LastValue(BarIndex())-(numbars/Hts), WeekHI, colorBlue);
  PlotText(" LWH " ,    LastValue(BarIndex())-(numbars/Hts), LWeekHI, colorBlue);
  PlotText(" 2WH " ,    LastValue(BarIndex())-(numbars/Hts), L1WeekHI, colorBlue);
  PlotText(" 3WH " ,    LastValue(BarIndex())-(numbars/Hts), L2WeekHI, colorBlue);
  PlotText(" 4WH " ,    LastValue(BarIndex())-(numbars/Hts), L3WeekHI, colorBlue);
  PlotText(" CMH " ,    LastValue(BarIndex())-(numbars/Hts), MonthHI, colorBlue);
  PlotText(" LMH " ,    LastValue(BarIndex())-(numbars/Hts), LMonthHI, colorBlue);
  PlotText(" 2MH " ,    LastValue(BarIndex())-(numbars/Hts), L1MonthHI, colorBlue);
  PlotText(" 3MH ",  	LastValue(BarIndex())-(numbars/Hts), L2MonthHI, colorBlue);
  PlotText(" 4MH " ,    LastValue(BarIndex())-(numbars/Hts), L3MonthHI, colorBlue);
  PlotText(" 5MH " ,    LastValue(BarIndex())-(numbars/Hts), L4MonthHI, colorBlue);

  PlotText(" PDL " ,    LastValue(BarIndex())-(numbars/Hts), DayLI, colorViolet);
  PlotText(" CWL " ,    LastValue(BarIndex())-(numbars/Hts), WeekLI, colorViolet);
  PlotText(" LWL " ,    LastValue(BarIndex())-(numbars/Hts), LWeekLI, colorViolet);
  PlotText(" 2WL " ,    LastValue(BarIndex())-(numbars/Hts), L1WeekLI, colorViolet);
  PlotText(" 3WL " ,    LastValue(BarIndex())-(numbars/Hts), L2WeekLI, colorViolet);
  PlotText(" 4WL " ,    LastValue(BarIndex())-(numbars/Hts), L3WeekLI, colorViolet);
  PlotText(" CML " ,    LastValue(BarIndex())-(numbars/Hts), MonthLI, colorViolet);
  PlotText(" LML " ,    LastValue(BarIndex())-(numbars/Hts), LMonthLI, colorViolet);
  PlotText(" 2ML " ,    LastValue(BarIndex())-(numbars/Hts), L1MonthLI, colorViolet);
  PlotText(" 3ML ",  	LastValue(BarIndex())-(numbars/Hts), L2MonthLI, colorViolet);
  PlotText(" 4ML " ,    LastValue(BarIndex())-(numbars/Hts), L3MonthLI, colorViolet);
  PlotText(" 5ML " ,    LastValue(BarIndex())-(numbars/Hts), L4MonthLI, colorViolet);

}

_SECTION_BEGIN("Background text");
C11=ParamColor("up panel",colorBlack );
C12=ParamColor("dn panel",colorBlack );
C13=Param("fonts",20,10,30,1 );
C14=Param("left-right",2.1,1.0,5.0,0.1 );
C15=Param("up-down",8,1,30,1 );
Miny = Status("axisminy");
Maxy = Status("axismaxy");
lvb = Status("lastvisiblebar");
fvb = Status("firstvisiblebar");
pxwidth = Status("pxwidth");
pxheight = Status("pxheight");
GfxSetBkMode( 0 );
GfxSelectFont("Tahoma", 12, 500, False, False, 0);
GfxSetTextColor(colorCustom12);
GfxSetTextAlign( 6 );
GfxTextOut( "ADM (Average Day Moment) "+WriteVal(ADM,1.2), Status("pxwidth")/C14, Status("pxheight")/C15*1.5);
GfxSelectFont("Tahoma", 15, 600, False, False, 0);
GfxSetTextColor(colorWhite);
GfxSetTextAlign( 6 );
GfxTextOut( "LTP "+WriteVal(C,1.2), Status("pxwidth")/C14, Status("pxheight")/C15);
GfxSelectFont("Tahoma", 12, 400, False, False, 0);
GfxSetTextColor(colorBrightGreen);
GfxTextOut(""+Bdc+"", Status("pxwidth")/C14, Status("pxheight")/C15*2.0);
GfxSelectFont("Tahoma", 12, 400, False, False, 0);
GfxSetTextColor(colorRed);
GfxTextOut(""+Sdc+"", Status("pxwidth")/C14, Status("pxheight")/C15*2.0);
GfxSelectFont("Tahoma", 12, 400, False, False, 0);
GfxSetTextColor(colorYellow);
GfxTextOut(""+Ndc+"", Status("pxwidth")/C14, Status("pxheight")/C15*2.0);
GfxSelectFont("Tahoma", 12, 400, False, False, 0);
GfxSetTextColor(colorGreen);
//GfxTextOut(""+BTdc+"", Status("pxwidth")/C14, Status("pxheight")/C15*2.5);
GfxSelectFont("Tahoma", 12, 400, False, False, 0);
GfxSetTextColor(colorGreen);
//GfxTextOut(""+STdc+"", Status("pxwidth")/C14, Status("pxheight")/C15*2.5);


pricechange=(C-Ref(C,-1))*100/Ref(C,-1);
changeponit=C-Ref(C,-1);
Vlp=Param("Volume lookback period",15,10,300,10);
Vrg=MA(V,Vlp);
St = StDev(Vrg,Vlp);
Vp3 = Vrg + 3*st;
Vp2 = Vrg + 2*st;;
Vp1 = Vrg + 1*st;;
Vn1 = Vrg -1*st;
Vn2 = Vrg -2*st;

x=Param("xposn",1,0,1000,1);
y=Param("yposn",1,0,1000,1);

GfxGradientRect( 1, 1, 1400, 40, colorGrey50, colorDarkGrey);
GfxSetBkMode(0);
GfxSelectFont( "Georgia", 18, 800, False );
GfxSetTextColor( colorWhite );
GfxTextOut( "ULTIMATE VOLATILITY EXPERT ", x+600, y+10 );
GfxSelectFont( "Tahoma", 16, 800, False );
GfxSetTextColor( colorGold );
GfxTextOut( Name(), x+100, y+10 );
GfxSelectFont( "Century Gothic", 15, 100, False );
GfxSetTextColor( colorWhite );
GfxTextOut( Date(), x+1000, y+10 );
GfxSelectFont( "Comic Sans MS", 15, 500, False );
GfxSetTextColor( colorYellow );
GfxTextOut( Interval(2), x+275, y+10 );
//------------------------------------------------------------ H, L, O, C----------------------
GfxGradientRect( 1, 40, 1400, 55, colorGrey50, colorDarkGrey );
GfxSetBkMode(0);
GfxSelectFont( "Areal", 9, 200, False );
GfxSetTextColor( colorWhite );
GfxTextOut( "High:"+WriteVal(H,1.2), x+100, y+40 );
GfxSelectFont( "Areal", 9, 200, False );
GfxSetTextColor( colorWhite );
GfxTextOut( "Low:"+WriteVal(L,1.2), x+200, y+40 );
GfxSelectFont( "Areal", 9, 200, False );
GfxSetTextColor( colorWhite );
GfxTextOut( "Open:"+WriteVal(O,1.2), x+300, y+40 );
GfxSelectFont( "Areal", 9, 200, False );
GfxSetTextColor( colorWhite );
GfxTextOut( "Close:"+WriteVal(C,1.2), x+400, y+40 );
GfxSelectFont( "Script MT Bold", 12, 100, False );
GfxSetTextColor( colorWhite );
GfxTextOut( "Created By Murali Krishna ", x+1000, y+39 );
//-----------------------------------------------------------Valume-------------------------------
GfxSelectFont( "Tahoma", 9, 200, False );
GfxSetTextColor( colorWhite );
GfxTextOut( "Volume="+WriteVal(V,1.2), x+500, y+40 );
GfxSelectFont( "Tahoma", 9, 200, False );
GfxSetTextColor( colorLime );
GfxTextOut( WriteIf(V>Vp2,"Very High",""), x+600, y+40 );
GfxSelectFont( "Tahoma", 9, 200, False );
GfxSetTextColor( colorLime );
GfxTextOut( WriteIf(V>Vp1," High",""), x+600, y+40 );
GfxSelectFont( "Tahoma", 9, 200, False );
GfxSetTextColor( colorLime );
GfxTextOut( WriteIf(V>Vrg,"Above Average",""), x+600, y+40 );
GfxSelectFont( "Tahoma", 9, 200, False );
GfxSetTextColor( colorRed );
GfxTextOut( WriteIf(V<Vrg AND V>Vn1,"Less than Average",""), x+600, y+40 );
GfxSelectFont( "Tahoma", 9, 200, False );
GfxSetTextColor( colorRed );
GfxTextOut( WriteIf(V<Vn1,"Low",""), x+600, y+40 );
//----------------------------------------------------------------Leveles----------------------------

GfxGradientRect( 1, 185, 90, 200, colorGrey50,colorDarkGrey );
GfxSetBkMode(0);
GfxSelectFont( "Tahoma", 10, 300, False );
GfxSetTextColor( colorOrange );
GfxTextOut( "Levels ", x+45, y+185 );

GfxGradientRect( 1, 200, 90, 215, colorDarkGrey,colorDarkRed );
GfxSetBkMode(0);
GfxSelectFont( "Tahoma", 10, 300, False );
GfxSetTextColor( colorWhite );
GfxTextOut( WriteIf (L4MonthH>C, " 5MH "+WriteVal(L4MonthH,1.2)+"  ",""), x+50, y+200 );

GfxGradientRect( 1, 215, 90, 230, colorDarkGrey, colorDarkRed );
GfxSetBkMode(0);
GfxSelectFont( "Tahoma", 10, 300, False );
GfxSetTextColor( colorWhite );
GfxTextOut( WriteIf (L3MonthH>C, " 4MH "+WriteVal(L3MonthH,1.2)+"  ",""), x+50, y+215 );

GfxGradientRect( 1, 230, 90, 245, colorDarkGrey, colorDarkRed );
GfxSetBkMode(0);
GfxSelectFont( "Tahoma", 10, 300, False );
GfxSetTextColor( colorWhite );
GfxTextOut( WriteIf (L2MonthH>C, " 3MH "+WriteVal(L2MonthH,1.2)+"  ",""), x+50, y+230 );

GfxGradientRect( 1, 245, 90, 260, colorDarkGrey, colorDarkRed );
GfxSetBkMode(0);
GfxSelectFont( "Tahoma", 10, 300, False );
GfxSetTextColor( colorWhite );
GfxTextOut( WriteIf (L1MonthH>C, " 2MH "+WriteVal(L1MonthH,1.2)+"  ",""), x+50, y+245 );

GfxGradientRect( 1, 260, 90, 275, colorDarkGrey, colorDarkRed );
GfxSetBkMode(0);
GfxSelectFont( "Tahoma", 10, 300, False );
GfxSetTextColor( colorWhite );
GfxTextOut( WriteIf (LMonthH>C, " LMH "+WriteVal(LMonthH,1.2)+"  ",""), x+50, y+260 );

GfxGradientRect( 1, 275, 90, 290, colorDarkGrey, colorDarkRed );
GfxSetBkMode(0);
GfxSelectFont( "Tahoma", 10, 300, False );
GfxSetTextColor( colorWhite );
GfxTextOut( WriteIf (MonthH>C, " CMH "+WriteVal(MonthH,1.2)+"  ",""), x+50, y+275 );

GfxGradientRect( 1, 290, 90, 305, colorDarkGrey, colorDarkRed );
GfxSetBkMode(0);
GfxSelectFont( "Tahoma", 10, 300, False );
GfxSetTextColor( colorWhite );
GfxTextOut( WriteIf (L3WeekH>C, " 4WH "+WriteVal(L3WeekH,1.2)+"  ",""),x+50, y+290 );

GfxGradientRect( 1, 305, 90, 320, colorDarkGrey, colorDarkRed );
GfxSetBkMode(0);
GfxSelectFont( "Tahoma", 10, 300, False );
GfxSetTextColor( colorWhite );
GfxTextOut( WriteIf (L2WeekH>C, " 3WH "+WriteVal(L2WeekH,1.2)+"  ",""), x+50, y+305 );

GfxGradientRect( 1, 320, 90, 335, colorDarkGrey, colorDarkRed );
GfxSetBkMode(0);
GfxSelectFont( "Tahoma", 10, 300, False );
GfxSetTextColor( colorWhite );
GfxTextOut( WriteIf (L1WeekH>C, " 2WH "+WriteVal(L1WeekH,1.2)+"  ",""), x+50, y+320 );

GfxGradientRect( 1, 335, 90, 350, colorDarkGrey, colorDarkRed );
GfxSetBkMode(0);
GfxSelectFont( "Tahoma", 10, 300, False );
GfxSetTextColor( colorWhite );
GfxTextOut( WriteIf (LWeekH>C, " 1WH "+WriteVal(LWeekH,1.2)+"  ","") , x+50, y+335 );

GfxGradientRect( 1, 350, 90, 365, colorDarkGrey, colorDarkRed );
GfxSetBkMode(0);
GfxSelectFont( "Tahoma", 10, 300, False );
GfxSetTextColor( colorWhite );
GfxTextOut( WriteIf (WeekH>C, " CWH "+WriteVal(WeekH,1.2)+"  ",""), x+50, y+350 );

GfxGradientRect( 1, 365, 90, 380, colorDarkGrey, colorDarkRed );
GfxSetBkMode(0);
GfxSelectFont( "Tahoma", 10, 300, False );
GfxSetTextColor( colorWhite );
GfxTextOut( WriteIf (DayH>C, " PDH "+WriteVal(DayH,1.2)+"  ",""), x+50, y+365 );

GfxGradientRect( 1, 380, 90, 395, colorLightBlue , colorBlue );
GfxSetBkMode(0);
GfxSelectFont( "Tahoma", 10, 300, False );
GfxSetTextColor( colorCustom12);
GfxTextOut( WriteIf (C, " LTP "+WriteVal(C,1.2)+"  ",""), x+50, y+380 );

GfxGradientRect( 1, 395, 90, 410, colorDarkGrey,colorDarkGreen);
GfxSetBkMode(0);
GfxSelectFont( "Tahoma", 10, 300, False );
GfxSetTextColor( colorWhite );
GfxTextOut( WriteIf (DayL<C, " PDL "+WriteVal(DayL,1.2)+"  ",""), x+50, y+395 );

GfxGradientRect( 1, 410, 90, 425, colorDarkGrey, colorDarkGreen );
GfxSetBkMode(0);
GfxSelectFont( "Tahoma", 10, 300, False );
GfxSetTextColor( colorWhite );
GfxTextOut( WriteIf (WeekL<C, " CWL "+WriteVal(WeekL,1.2)+"  ",""), x+50, y+410 );

GfxGradientRect( 1, 425, 90, 440, colorDarkGrey, colorDarkGreen );
GfxSetBkMode(0);
GfxSelectFont( "Tahoma", 10, 300, False );
GfxSetTextColor( colorWhite );
GfxTextOut( WriteIf (LWeekL<C, " 1WL "+WriteVal(LWeekL,1.2)+"  ",""), x+50, y+425 );

GfxGradientRect( 1, 440, 90, 455, colorDarkGrey, colorDarkGreen );
GfxSetBkMode(0);
GfxSelectFont( "Tahoma", 9, 300, False );
GfxSetTextColor( colorWhite );
GfxTextOut( WriteIf (L1WeekL<C, " 2WL "+WriteVal(L1WeekL,1.2)+"  ",""), x+50, y+440);

GfxGradientRect( 1, 455, 90, 470, colorDarkGrey, colorDarkGreen );
GfxSetBkMode(0);
GfxSelectFont( "Tahoma", 10, 300, False );
GfxSetTextColor( colorWhite );
GfxTextOut( WriteIf (L2WeekL<C, " 3WL "+WriteVal(L2WeekL,1.2)+"  ",""), x+50, y+455);

GfxGradientRect( 1, 470, 90, 485, colorDarkGrey, colorDarkGreen );
GfxSetBkMode(0);
GfxSelectFont( "Tahoma", 10, 300, False );
GfxSetTextColor( colorWhite );
GfxTextOut( WriteIf (L3WeekL<C, " 4WL "+WriteVal(L3WeekL,1.2)+"  ",""), x+50, y+470);

GfxGradientRect( 1, 485, 90, 500, colorDarkGrey, colorDarkGreen );
GfxSetBkMode(0);
GfxSelectFont( "Tahoma", 10, 300, False );
GfxSetTextColor( colorWhite );
GfxTextOut( WriteIf (MonthL<C, " CML "+WriteVal(MonthL,1.2)+"  ",""), x+50, y+485);

GfxGradientRect( 1, 500, 90, 515, colorDarkGrey, colorDarkGreen );
GfxSetBkMode(0);
GfxSelectFont( "Tahoma", 10, 300, False );
GfxSetTextColor( colorWhite );
GfxTextOut( WriteIf (LMonthL<C, " 1ML "+WriteVal(LMonthL,1.2)+"  ",""), x+50, y+500);

GfxGradientRect( 1, 515, 90, 530, colorDarkGrey, colorDarkGreen );
GfxSetBkMode(0);
GfxSelectFont( "Tahoma", 10, 300, False );
GfxSetTextColor( colorWhite );
GfxTextOut( WriteIf (L1MonthL<C, " 2ML "+WriteVal(L1MonthL,1.2)+"  ",""), x+50, y+515);

GfxGradientRect( 1, 530, 90, 545, colorDarkGrey, colorDarkGreen );
GfxSetBkMode(0);
GfxSelectFont( "Tahoma", 10, 300, False );
GfxSetTextColor( colorWhite );
GfxTextOut( WriteIf (L2MonthL<C, " 3ML "+WriteVal(L2MonthL,1.2)+"  ",""), x+50, y+530);

GfxGradientRect( 1, 545, 90, 560, colorDarkGrey, colorDarkGreen );
GfxSetBkMode(0);
GfxSelectFont( "Tahoma", 10, 300, False );
GfxSetTextColor( colorWhite );
GfxTextOut( WriteIf (L3MonthL<C, " 4ML "+WriteVal(L3MonthL,1.2)+"  ",""), x+50, y+545);

GfxGradientRect( 1, 560, 90, 575, colorDarkGrey, colorDarkGreen );
GfxSetBkMode(0);
GfxSelectFont( "Tahoma", 10, 300, False );
GfxSetTextColor( colorWhite );
GfxTextOut( WriteIf (L4MonthL<C, " 5ML "+WriteVal(L4MonthL,1.2)+"  ",""), x+50, y+560);

no=Param( "Swing", 8, 1, 55 );
tsl_col=ParamColor( "Color", colorLightGrey );
res=HHV(H,no);
sup=LLV(L,no);
avd=IIf(C>Ref(res,-1),1,IIf(C<Ref(sup,-1),-1,0));
avn=ValueWhen(avd!=0,avd,1);
tsl=IIf(avn==1,sup,res);

no =  Optimize("TSL",Param("A (Change To Optimise)",10, 1, 55 ,1),1, 55 ,1);

tsl_col=ParamColor( "Color", colorLightGrey );
res=HHV(H,no);
sup=LLV(L,no);
avd=IIf(C>Ref(res,-1),1,IIf(C<Ref(sup,-1),-1,0));
avn=ValueWhen(avd!=0,avd,1);
dtsl=IIf(avn==1,sup,res);
SellPrice=ValueWhen(Short,C,1);
BuyPrice=ValueWhen(Buy,C,1);
Long=Flip(Buy,Sell);
Shrt=Flip(Short,Cover);
Relax = NOT Long AND NOT Buy AND NOT shrt AND NOT Sell AND NOT Sell AND NOT Cover;
SellSL=ValueWhen(Short,DTSL,1);
BuySL=ValueWhen(Buy,DTSL,1);
BuyDifference= BuyPrice - BuySL;
SellDifference = SellSL - SellPrice;

tar1 = IIf(Buy OR Long AND NOT Relax AND NOT Sell AND NOT Cover, (BuyPrice + BuyDifference), (SellPrice - SellDifference));
tar2 = IIf(Buy OR Long AND NOT Relax AND NOT Sell AND NOT Cover, (BuyPrice + (2*BuyDifference)), (SellPrice - (2*SellDifference)));
tar3 = IIf(Buy OR Long AND NOT Relax AND NOT Sell AND NOT Cover, (BuyPrice + (4*BuyDifference)), (SellPrice - (4*SellDifference)));


CloseAtEnd = ParamToggle("Close Positions EOD", "No|Yes");
stopreverse =ParamToggle("Switch To Stop And Reverse","No|Yes",0);
Trend = ATR(21) < StDev (C,21);
Range = ATR(21) > StDev (C,21);
no=10;
C13=20;
C14=2.1;
C15=12;

tsl_col=ParamColor( "Color", colorLightGrey );
res=HHV(H,no);
sup=LLV(L,no);
avd=IIf(C>Ref(res,-1),1,IIf(C<Ref(sup,-1),-1,0));
avn=ValueWhen(avd!=0,avd,1);
dtsl=IIf(avd==1,sup,res);

SellPrice=ValueWhen(Short,C,1);
BuyPrice=ValueWhen(Buy,C,1);
Long=Flip(Buy,Sell);
Shrt=Flip(Short,Cover);
Relax = NOT Long AND NOT Buy AND NOT shrt AND NOT Sell AND NOT Sell AND NOT Cover;
SellSL=ValueWhen(Short,DTSL,1);
BuySL=ValueWhen(Buy,DTSL,1);
BuyDifference= BuyPrice - BuySL;
SellDifference = SellSL - SellPrice;

//tar1 = IIf(Buy OR Long AND NOT Relax AND NOT Sell AND NOT Cover, (BuyPrice + BuyDifference), (SellPrice - SellDifference));
//tar2 = IIf(Buy OR Long AND NOT Relax AND NOT Sell AND NOT Cover, (BuyPrice + (2*BuyDifference)), (SellPrice - (2*SellDifference)));
//tar3 = IIf(Buy OR Long AND NOT Relax AND NOT Sell AND NOT Cover, (BuyPrice + (4*BuyDifference)), (SellPrice - (4*SellDifference)));
buyach1 = IIf((Buy OR Long AND NOT Relax AND NOT Cover AND NOT Short AND NOT Shrt), H > tar1, 0);
buyach2 = IIf((Buy OR Long AND NOT Relax AND NOT Cover AND NOT Short AND NOT Shrt), H > tar2 , 0);
buyach3 = IIf((Buy OR Long AND NOT Relax AND NOT Cover AND NOT Short AND NOT Shrt), H > tar3, 0);

sellach1 = IIf((Short OR Shrt AND NOT Relax AND NOT Sell AND NOT Buy AND NOT Long), L < tar1 , 0);
sellach2 = IIf((Short OR Shrt AND NOT Relax AND NOT Sell AND NOT Buy AND NOT Long), L < tar2, 0);
sellach3 = IIf((Short OR Shrt AND NOT Relax AND NOT Sell AND NOT Buy AND NOT Long), L < tar3, 0);


// User-defined parameter for EMA periods

EMA_Type		= Param("EMA-1, TEMA-2, JMA-3", 2, 1, 3, 1);
EMA_prds 		= Param("EMA_periods", 7, 1, 30, 1);
Std_MACD		= Param("Standard MACD? No-0, Yes-1", 1, 0, 1, 1);
Plot_fashion	= Param("Bar+Arrows-1, Impulse  Bars-2", 2, 1, 2, 1);


// Allow user to define Weekly and Monthly Ribbon Location and Height
WR_P1 = Param("Weekly Ribbon Location", -10.5, -1000, 1000, 0.1);
WR_P2 = Param("Weekly Ribbon Height", 366.5, -0.001, 500, 0.1);

MR_P1 = Param("Monthly Ribbon Location", 5.2, -1000, 1000, 0.1);
MR_P2 = Param("Monthly Ribbon Height", 199, -0.001, 500, 0.1);


// Compute EMA and MACD Histogram
if(EMA_Type == 1)
{
	DayEMA	= EMA(Close, EMA_prds);
}
if (EMA_Type == 2)
{
	DayEMA	= TEMA(Close, EMA_prds);
}

if(EMA_Type == 3)
{
	// Line below to be used with Jurik JMA
	// DayEMA = JurikJMA(C, EMA_Prds);
}

Histogram	= MACD() - Signal();

// Determine if we have an Impulse UP, DOWN or None
Impulse_Up		=	DayEMA > Ref(DayEMA, -1) AND Histogram > Ref(Histogram, -1);
Impulse_Down	=	DayEMA < Ref(DayEMA, -1) AND Histogram < Ref(Histogram, -1);
Impulse_None		=	(NOT Impulse_UP) AND (NOT Impulse_Down);

// Compute Weekly MACD and determine whether rising or falling
// Note: uses "non-standard"  parameters!
TimeFrameSet(inWeekly);

if (Std_MACD == 0)
{
MACD_val		=	MACD(5, 8);
Signal_val		=	Signal(5, 8, 5);
}
else
{
MACD_val		=	MACD(12, 26);
Signal_val		=	Signal(12, 26, 9);
}

Hist_in_w		=	MACD_val - Signal_val;

wh_rising = Hist_in_w > Ref(Hist_in_w, -1);
wh_falling = Hist_in_w < Ref(Hist_in_w, -1);

TimeFrameRestore();

// Now get Monthly MACD Histogram....
TimeFrameSet(inMonthly);
MACD_val		=	MACD(5, 8);
Signal_val		=	Signal(5, 8, 5);
Hist_in_m		=	MACD_val - Signal_val;

mh_rising = Hist_in_m > Ref(Hist_in_m, -1);
mh_falling = Hist_in_m < Ref(Hist_in_m, -1);

TimeFrameRestore();

wh_rising 		= TimeFrameExpand( wh_rising, inWeekly, expandLast );
wh_falling 		= TimeFrameExpand( wh_falling, inWeekly, expandLast);
mh_rising 	= TimeFrameExpand(mh_rising, inMonthly, expandLast);
mh_falling 	= TimeFrameExpand(mh_falling, inMonthly, expandLast);

kol 	= IIf( wh_rising, colorGreen,  IIf(wh_falling, colorRed,
colorLightGrey));
mkol 	= IIf( mh_rising, colorBlue,  IIf(mh_falling, colorYellow,
colorLightGrey));

// Plot them all!
if (Plot_fashion == 1)
{
	Plot(Close, "Close", colorTeal, styleBar);
	PlotShapes(shapeUpArrow * Impulse_Up, colorBlue, 0, Low, -12);
	PlotShapes(shapeDownArrow * Impulse_Down, colorRed, 0, High, -12);
	PlotShapes(shapeSmallCircle * Impulse_None, colorWhite, 0, High, 5);
}
else
{
	bar_kol	=	IIf(impulse_UP, colorBlue, IIf(impulse_Down, colorRed,
colorWhite));
	//Plot(C, "Close", bar_kol, styleBar);
}

Plot(10, "ribbon", kol, styleOwnScale|styleArea|styleNoLabel, WR_P1, WR_P2);//Weekly trend

Plot(10, "ribbon", mkol, styleOwnScale|styleArea|styleNoLabel, MR_P1,
MR_P2);	// Monthly Trend

// Explorer Section
// Determine if Impulse status is bullish, neutral or bearish.  Display as Text Column.

Impulse_State		=	WriteIf(Impulse_Up, "Bul", WriteIf(Impulse_Down,
"Bear", "Neut"));

// Set the background color for Impulse Status Column
Impulse_Col		=	IIf(Impulse_Up, colorGreen, IIf(Impulse_Down, colorRed,
colorLightGrey));

// Determine Weekly Trend. Display as Text Column
Weekly_Trend		=	WriteIf(wh_rising, "Rising", WriteIf(wh_falling, "Falling",
"Flat!"));
Weekly_Col		=	IIf(wh_rising, colorGreen, IIf(wh_falling, colorRed,
colorLightGrey));

// Determine Monthly Trend. Display as Text Column
Monthly_Trend	=	WriteIf(mh_rising, "Rising", WriteIf(mh_falling, "Falling",
"Flat!"));
Monthly_Col		=	IIf(mh_rising, colorGreen, IIf(mh_falling, colorRed,
colorLightGrey));

// Determine how many bars has the current state existed
bars_in_bull	=	Min(BarsSince(impulse_none), BarsSince(impulse_down));
bars_in_bear	=	Min(BarsSince(impulse_up), BarsSince(impulse_none));
bars_in_neut	=	Min(BarsSince(impulse_down), BarsSince(impulse_up));

// Set a single variable to show number of bars in current state depending upon

// actual Impulse Status - Bullish, Bearish or Neutral
bars_in_state	=	IIf(Impulse_Up,bars_in_bull, IIf(Impulse_down, bars_in_bear,bars_in_neut));
//AddColumn(Close,"Close",1.2);
// Columns for display in Explorer
//AddTextColumn(Impulse_State, "Status", 1, colorWhite, Impulse_Col);
//AddColumn(bars_in_state, "Bars", 1, colorWhite, Impulse_col);
//Action = WriteIf(Buy, "BUY", WriteIf(Sell, "SELL", "   "));
//i=0;
//bars_in_statee	=	IIf(Buy, BarCount[i], IIf(Sell, BarCount[i],bars_in_neut));
//bars=BarsSince(IIf(Buy+BarCount+1),OR( Sell-BarCount+1));

//plus= Param("plus", 0.8,0,52,1);
//Minus = Param("Minus", -0.8,-15,-0,-20);
prch = (C- TimeFrameGetPrice( "C", inDaily, -1 ))/ TimeFrameGetPrice( "C", inDaily, -1 )*100 ;
prcha= (C-Ref(C,-6))/Ref(C,-6)*100;
prche= (C-Ref(C,-2))/Ref(C,-1)*100;
prchjk= (C-Ref(C,-2))+Ref(C,-1)*10/1;
//prchjka=(prchjk)/10;

prchjka = (C+ TimeFrameGetPrice( "C", inDaily, -1 ))- Close;

//Date()
//prchjk= (Date()-Ref(Date(),-1))+Ref(Date(),-1);
prch5=(prche-prch);
prch6= (C-Ref(C,-5))/Ref(C,-5)*100;
prch7= (C-Ref(C,-29))/Ref(C,-29)*100;
prch8= (C-Ref(C,-87))/Ref(C,-87)*100;
prch9= (C-Ref(C,-150))/Ref(C,-150)*100;
prch10= (C-Ref(C,-254))/Ref(C,-252)*100;
prch11= (C-Ref(C,-490))/Ref(C,-490)*100;
prch12= (C-Ref(C,-735))/Ref(C,-735)*100;
prch13= (C-Ref(C,-1283))/Ref(C,-1283)*100;


col=IIf ((Volume > 1.25 * EMA( Volume, 34 )),colorRed,colorLime);
//Col=IIf(( Buy, 66 , 83 ),  formatChar, colorDefault, IIf( plus , colorGreen, colorRed ));

//Filter = prch6 <3 OR prch6  <-3 ;
if(prexplore==0)
{Filter = prch > plus OR prch  < Minus  ;
AddColumn(prchjka ,"prvClose",colorDefault,Col,colorPlum);
AddColumn(Close,"Close",1.2,colorDefault, Col);
AddColumn(prch5,"prviday", 1.2,colorDefault, Col);
AddColumn(prch,"daily", 1.2,colorDefault, Col);
//Filter=0;
AddColumn( IIf( Buy, 66 , 83 ), "Signal", formatChar, colorDefault, IIf( Buy , colorGreen, colorRed ) );

AddColumn(Volume,"Volume",1.0, colorDefault, IIf ((Volume > 1.25 * EMA( Volume, 34 )),colorCustom12,colorLime));
AddColumn(prch6,"weekly", 1.2,colorDefault, Col);
AddColumn(prch7,"monthly", 1.2,colorDefault, Col);
AddColumn(prch8,"qutrly", 1.2,colorDefault, Col);
AddColumn(prch9,"halfyly", 1.2,colorDefault, Col);
AddColumn(prch10,"yearly", 1.2,colorDefault, Col);
AddColumn(prch11,"twoyrly", 1.2,colorDefault, Col);
AddColumn(prch12,"thirdyrly", 1.2,colorDefault, Col);
AddColumn(prch13,"fiveyrly", 1.2,colorDefault, Col);

}
else
{

//Filter =  Sell>-2 AND i<-3 OR Buy>2 AND i<3 ;
AddColumn(ROC(V,1),"RVol ",1.2, IIf(ROC(V,1) > 0,colorDefault,colorYellow),Impulse_col);

AddColumn(bars_in_state ,"Bars", 1, colorWhite, Impulse_col);
prchjka = (C+ TimeFrameGetPrice( "C", inDaily, -1 ))- Close;

//AddColumn(C + C +1 ,"Close",1.2,colorDefault, Col)/2;
AddColumn(prchjka ,"prvClose",colorDefault,colorWhite, colorBlue);
//AddTextColumn(Weekly_Trend, "W Trend", 1, colorWhite, Weekly_Col);
//AddTextColumn(Monthly_Trend, "M Trend", 1, colorWhite, Monthly_Col);

//Filter = 1;

_SECTION_END();
//Settings for exploration

H1 = SelectedValue( TimeFrameGetPrice( "H", inDaily, -1 ) );
L1 = SelectedValue( TimeFrameGetPrice( "L", inDaily, -1 ) );
C1 = SelectedValue( TimeFrameGetPrice( "C", inDaily, -1 ) );
H2 = SelectedValue( TimeFrameGetPrice( "H", inDaily, 0 ) );
L2 = SelectedValue( TimeFrameGetPrice( "L", inDaily, 0 ) );
O1 = SelectedValue( TimeFrameGetPrice( "open", inDaily, 0 ) );
F4 = 0;
D1 = ( H1 - L1 );
D2 = ( H2 - L2 );
F1 = D1 * 0.433;
F2 = D1 * 0.766;
F3 = D1 * 1.35;
if ( D2 <= F1 )
    F4 = F1;
else
    if ( D2 <= F2  )
        F4 = F2;
    else
        F4 = F3;

S_P = ( O1 - F4 );

B_P = ( O1 + F4 );

BP = ( L2 + F4 );

BPTGT = ( BP + ( BP * .0065 ) );//.0015 brokerage

BPSTPLS = ( BP - ( BP * .0085 ) );

SP = ( H2 - F4 );

SPTGT = ( SP - ( SP * .0065 ) );

SPSTPLS = ( SP + ( SP * .0085 ) );


p = ( H1 + L1 + C1 ) / 3;

s1 = ( H1 );

r1 = ( L1 );

r2 = SelectedValue( L2 );

s2 = SelectedValue( H2 );

//CONDITION

if (ParamToggle("Tooltip shows", "All Values|Only Prices"))
{
  ToolTip = StrFormat("Open: %g\nHigh:  %g\nLow:   %g\nClose:  %g (%.1f%%) \nVolume: " + NumToStr(V, 1), O, H, L, C, SelectedValue(ROC(C, 1)));
}

//space = Param("Space on Chart", 20,  - 15, 50, 1);
//GraphXSpace = space;
//SetChartBkColor(ParamColor("Background Color", colorBlack));

// ================= Rasheed's original code (with Lookback and Shift default set to his specs) =================

H0 = H;
L0 = L;
C0 = C;
O0 = O;

Lookback = Param("LookBack", 10, 10, 50, 1); // Default for interday commodity currency trading
shift = Param("Shift", 5, 1, 50, 1); // ?
x0 = LastValue(Cum(1));
x1 = x0 - shift;
H = Ref(H,  - shift + 1);
L = Ref(L,  - shift + 1);
H1 = LastValue(Ref(HHV(H, Lookback),  - 1));
L1 = LastValue(Ref(LLV(L, Lookback),  - 1));

//Plot(H1, "H1", colorYellow);
//Plot(L1, "L1", colorYellow);

H = H0;
L = L0;
C = C0;
O = O0;

up = Cross(H, H1)AND Cum(1) > x1;
dn = Cross(L1, L)AND Cum(1) > x1;

//Plot(C, "Close", IIf(Cum(1) > x1 - Lookback AND Cum(1) <= x1, colorBlue, IIf(Up, colorBrightGreen, IIf(Dn, colorRed, IIf(C > O, colorGreen, colorRed)))), 64);
//PlotShapes(shapeDownArrow *(Cum(1) == x1 + 1), colorBlue);

// ======================= Exploration and Signal Code =================
TRIGGER = ParamToggle("Trigger ", "CLOSE|HIGH OR LOW");


XH1 = Cross(C, H1);
XL1 = Cross(L1, C);
XH2 = Cross(H, H1);
XL2 = Cross(L1, L);

if (TRIGGER == 0)
{
  //Buy = XH1;
  //Sell = XL1;
}

else
{
  //Buy = XH2;
  //Sell = XL2;
}


//TradeDisplay = ParamToggle("Remove Extra Trades?", "No|Yes");

//if(TradeDisplay != 0){
	//Buy = ExRem(Buy, Sell);
  	//Sell = ExRem(Sell, Buy); // THIS WILL REMOVE EXESS SIGNALS ON A CHART OR IN AN EXPLORATION
//}

//Filter =  Buy >2 <3 == BarCount+1 OR Sell >-3<-3 == BarCount+1;
Action = WriteIf(Buy, "BUY", WriteIf(Sell, "SELL", "   "));

//AddTextColumn(IndustryID(1), "Industry Sector  ", 30.0, colorBlue, colorYellow);
AddColumn(C, "Entry ", 2.2, colorWhite, colorBlue);
AddTextColumn(Action, "Action", 8.0, IIf(xh1, colorDarkGreen, colorDarkRed), colorYellow);
AddColumn(IIf(XH1, H1, L1), "BREAKOUT LEVEL", 3.2, colorYellow, IIf(XH1, colorDarkGreen, colorDarkRed));

// -----------------------------------------------------------------------------------  Arrow signals --- FOR TRADES  ----------------------------------------------------------
//PlotShapes(Buy *shapeUpArrow, colorBrightGreen, 0, L /* ENTRY_TRAILARRAY */,  - 30);
//PlotShapes(Sell *shapeDownArrow, colorLightYellow, 0, H,  - 30);
_SECTION_END();


_SECTION_BEGIN("Volume At Price");
PlotVAPOverlay(Param("Lines", 1000, 100, 1000, 10), Param("Width", 15, 1, 100, 1), ParamColor("Color", colorBlue), ParamToggle("Side", "Left|Right", 1) | 4 *ParamToggle("Z-order", "On top|Behind", 1));

_SECTION_END();
//Filter =  Buy OR Sell;

//AddColumn( IIf( Buy, 66, 1 ), "Buy", formatChar, 1, bkcolor = IIf( Buy, 43, 33 ) );

//AddColumn( IIf( Sell, 83, 1 ), "Sell", formatChar, 1, bkcolor = IIf( Sell, 25, 32 ) );


//AddColumn( C, "CMP", 1.2, colorDefault, colorLightBlue );

//AddColumn( BP, "SELL PRICE", 1.2, colorDefault, colorGreen );

//AddColumn( BPTGT, "TGT PRICE", 1.2, colorDefault, colorBrown );

//AddColumn( BPSTPLS, "STPLS BUY", 1.2, colorDefault, colorRed );

AddColumn( p, "PIVOT", 1.2, colorDefault, colorYellow );

//AddColumn( SPSTPLS, "STPLS SELL", 1.2, colorDefault, colorRed );

//AddColumn( SP, "SELL PRICE", 1.2, colorDefault, colorGreen );

//AddColumn( SPTGT, "TGT PRICE", 1.2, colorDefault, colorBrown );


//Settings for exploration

Filter=Buy OR Sell AND Cover OR Short;
AddColumn( IIf( Buy, 66 , 83 ), "Signal", formatChar, colorDefault, IIf( Buy , colorGreen, colorRed ) );

//AddColumn(Close,"Entry Price",1.4, colorDefault, IIf( Buy , colorGreen, colorRed ));
//AddColumn(dtsl,"Stop Loss",1.4, colorDefault, IIf( Buy , colorGreen, colorRed ));
//AddColumn(tar1,"Target 1",1.4, colorDefault, IIf( Buy , colorGreen, colorRed ));
//AddColumn(tar2,"Target 2",1.4, colorDefault, IIf( Buy , colorGreen, colorRed ));
//AddColumn(tar3,"Target 3",1.4, colorDefault, IIf( Buy , colorGreen, colorRed ));
AddColumn(Volume,"Volume",1.0, colorDefault, IIf ((Volume > 1.25 * EMA( Volume, 34 )),colorBlue,colorYellow));
AddColumn( H1, "PRE-HIGH" );

AddColumn( L1, "PRE-LOW" );

AddColumn( D1, "PRE-DIFF" );

AddColumn( F1, "0.433" );

AddColumn( F2, "0.766" );

AddColumn( F3, "1.35" );

AddColumn( H2, "D-HIGH" );

AddColumn( L2, "D-LOW" );

AddColumn( D2, "D-DIFF" );

AddColumn( F4, "SELECT FACT" );

AlertIf( Buy , "SOUND C:\\Windows\\Media\\chimes.wav", "Audio alert", 2 );
AlertIf( Sell , "SOUND C:\\Windows\\Media\\alert.wav", "Audio alert", 2 );

}
9 comments
Leave Comment
Please login here to leave a comment.
Back
Dear Murali Sir
Good work done again , i am a fan of yours and i always wait to see any new AFL being posted by you .
Sir , i this AFL i want to use normal candlesticks instead of hekin Ashi and also donot want to use bands . Pls help me to sort out the issue .
dear k3325, this modified version is not posted by me
this afl is created by jaipal7786
we are developing our ultimate volatility expert, this new version will be posted soon
thanks
Hai sir i dont find any buy/ sell signal in this afl pls rectify and reply
Dear jaipal sir ; could u resolve our issue . I just want to have normal candlesticks and also donot want bands . It will be very helpful if u pls guide me .
Nice modification! what do I need to change for EOD rather than Intradad?
Dick
Thanks Dear Jaipal
Could you explain the behavior of the chart as to when to go long and when go short?
thanks jaipal for posting and modifying this. as stated by sriram already in comments, buy sell signals are not showing and indicator at bottom is also not showing
Dear Murali Krishna sir,
I am a new user and doing commodity trade. I want to know how to your best trading software tool in my amibroker. My contact number 9381001802. Please guide me sir
Dear Murali ji ,
Can this AFL be filtered for stop loss as i am having Robo Trade Software so as u told that the White trend Line is to be used for stop loss so is it possible to make and exit filter there so that trade may be executed there.
Regards
Sameer Chaturvedi
09136115070