Stock Portfolio Organizer
The ultimate porfolio management solution.
Shares, Margin, CFD's, Futures and Forex
EOD and Realtime
Dividends and Trust Distributions
And Much More ....
WiseTrader Toolbox
#1 Selling Amibroker Plugin featuring:
Advanced Adaptive Indicators
Advanced Pattern Exploration
Neural Networks
And Much More ....
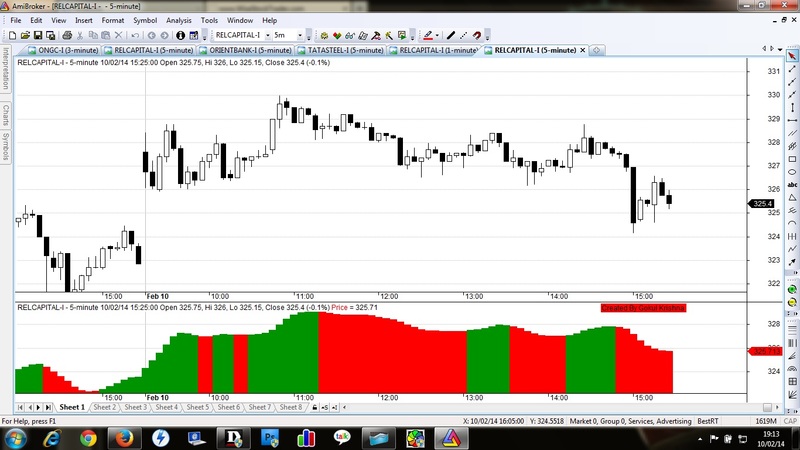
Heikin Ashi - for a change use it as a indicator for Amibroker (AFL)
Rating:
4 / 5 (Votes 6)
Tags:
amibroker, heikin
THIS IS A MODIFICATION OF PULSAR SYSTEM FROM http://www.wisestocktrader.com/indicators/1907-pulsar-system THE CREDIT GOES TO ORIGINAL PROGRAMMER. WE HAVE SOME CONFUSIONS WHILE USING Heiken Ashi LIKE CMP SELL AND BUY LEVELS. NOW ONE CAN USE IT AS A LOWER INDICATOR ALONG WITH NORMAL PRICE CHART SO WE CAN SEE SUPPORT & RESISTANCE LEVEL VERY EASILY. HIGHER THE CHART TIME FRAME GIVES MORE ACCURACY. ENJOY TRADING.
Screenshots
Similar Indicators / Formulas
Heikin Ashi
Submitted
by kaiji over 14 years ago
Heikin-Ashi
Submitted
by mlnd1986 about 14 years ago
Heikin Ashi Easy System
Submitted
by felippemiranda over 10 years ago
heikin ashi with KPL system
Submitted
by viplavmba over 13 years ago
TTM Trend Clone
Submitted
by kaiji about 14 years ago
Vikram's Floor Pivot Intraday System
Submitted
by kaiji about 14 years ago
Indicator / Formula
Copy & Paste Friendly
_SECTION_BEGIN("Price");
SetChartOptions(0,chartShowArrows|chartShowDates);
_N(Title = StrFormat("{{NAME}} - {{INTERVAL}} {{DATE}} Open %g, Hi %g, Lo %g, Close %g (%.1f%%) {{VALUES}}", O, H, L, C, SelectedValue( ROC( C, 1 ) ) ));
//Plot( C, "Close", ParamColor("Color", colorDefault ), styleNoTitle | ParamStyle("Style") | GetPriceStyle() );
_SECTION_END();


x=Param("xposn",1,0,1000,1);
y=Param("yposn",1,0,1000,1);

GfxSetTextColor( colorBlack );
GfxTextOut( "Created By Gokul Krishna ", x+1000, y+0 );


/*Developed by Tudor Marcelin - Art Invest*/
HLper=Param("EMA period",21,3,35);
Lagper=Param("Lag period",10,3,35);

HL=EMA(H-L,HLper);
LagEMA=Ref(HL,(-1)*Lagper);

VCF=100*(HL-LagEMA)/LagEMA;
//ATR
procedure ATRf(Hp,Lp,Cp,per)
{

TR=Max(Hp-Lp,Max(abs(Hp-Ref(Cp,-1)),abs(Ref(Cp,-1)-Lp)));

TRI=Wilders(TR,per);
return TRI;
}

//Moving Average
procedure MAList(type)
{
global MAType;
global MAName;
chList =
ParamList("Type",
List = "1 - EMA,2 - WMA,3 - DEMA,4 - WILDERS", type-1);
for( i=0; i<5; i++)
{if( StrExtract(List, i) == chList ) MAType = i+1;}
MAName =
WriteIf(MAType == 1,"EMA",
WriteIf(MAType == 2,"WMA",
WriteIf(MAType == 3,"DEMA",
WriteIf(MAType == 4,"WILDERS",""))));
}


procedure MAFormula(array,per,type)
{
CallFormula =
IIf(type == 1,EMA(array,Per),
IIf(type == 2,WMA(array,Per),
IIf(type == 3,DEMA(array,Per),
IIf(type == 4,Wilders(array,Per),Null))));
return CallFormula;
}

MAList(2);


_SECTION_BEGIN("Heikin Ashi Smoothed");
per1=Param("MA1 period",6,1,10);
per2=Param("MA2 period",2,1,10);
/*
HaOpen = IIf(BarIndex()>0,(Ref((O+H+L+C)/4,-1) + Ref(O,-1))/2 ,Open);
HaClose = IIf(BarIndex()>0,((O+H+L+C)/4 +HaOpen+Max(H,HaOpen)+Min(L,HaOpen))/4,Close);
HaHigh = Max( H, Max( HaClose, HaOpen ) );
HaLow = Min( L, Min( HaClose, HaOpen ) );
*/

mO=MAFormula(O,per1,MAType);
mH=MAFormula(H,per1,MAType);
mL=MAFormula(L,per1,MAType);
mC=MAFormula(C,per1,MAType);

HaClose1 = IIf(BarIndex()>0,(MO+MH+ML+MC)/4,Close);
HaOpen1 = IIf(BarIndex()>0,AMA( Ref( HaClose1, -1 ), 0.5 ),Open);

HaClose=EMA(HaClose1,per2);
HaOpen=EMA(HaOpen1,per2);

HaHigh = Max( mH, Max( HaClose, HaOpen ) );
HaLow = Min(mL, Min( HaClose, HaOpen ) );

_SECTION_END();

//O=HaOpen;
//H=HaHigh;
//L=HaLow;
//C=HaClose;

//Plot( Close,"Price",colorBlack,styleCandle);
barcolor = IIf(HaClose >= HaOpen,colorGreen,colorRed);

PlotOHLC(HaOpen,HaHigh,HaLow,HaClose,"Price", barcolor, styleArea);

 _N(Title = StrFormat("{{NAME}} - {{INTERVAL}} {{DATE}} Open %g, Hi %g, Lo %g, Close %g (%.1f%%) {{VALUES}}", O, H, L, C, SelectedValue( ROC( C, 1 ) ) ));
1 comments
Leave Comment
Please login here to leave a comment.
Back
Very good Indicator