Stock Portfolio Organizer
The ultimate porfolio management solution.
WiseTrader Toolbox
#1 Selling Amibroker Plugin featuring:
NIRMAL.INDICATOR.V3 for Amibroker (AFL)
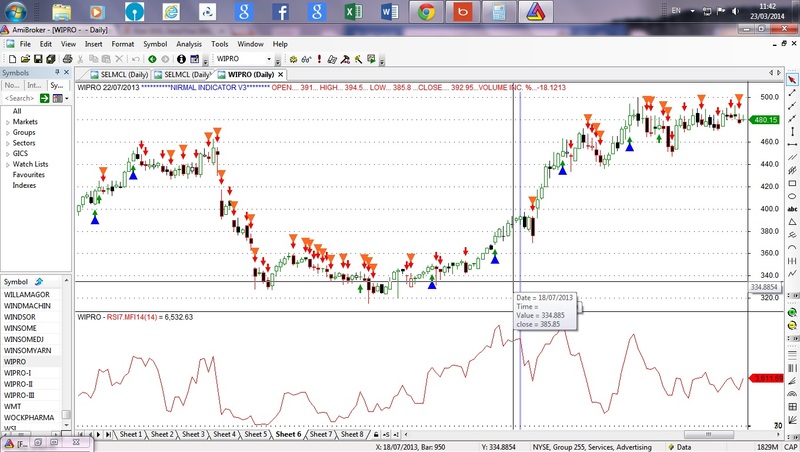
This is an extensive modification of buy and sell logic of my earlier afl—
“buy on first green arrow”. This afl is aimed at giving more
buy signals and modified sell signals. The same rule of ignoring
buy signals at contact points of resistance applies to this afl
also. Have a look at the enclosed chart. Observe the bottom to understand better, the behaviour of afl. Green arrow is buy.red arrow is sell. green plus blue is strong buy, orange plus red is strong sell. Inspite of strong sell signals at bottom, the price did not fall. This means that buying pressure is equally emerging.It means, bottom has formed. after some time, strong buy signal is emerged. this is a sure shot.This afl is born within my capacities/limitations, 5 years of my trading experience and understanding of market. hope you like it. please rate it and leave your comments if you like it. I request the administrator to make the afl visible to only the registered users, if approved.
Screenshots
Similar Indicators / Formulas
Indicator / Formula
MYVOL= IIf(((V-EMA(V,7))/EMA(V,7))*100>10,0,1);
VOLPERCENT=((V-EMA(V,7))/EMA(V,7))*100;
MYGAPUP=IIf(O>Ref(C,-1) AND O>Ref(O,-1) AND C>O AND ((C-Ref(C,-1))/Ref(C,-1))*100>1,1,0);
MYVALUE=IIf(MYGAPUP==1 AND Ref(MYGAPUP,-1)==1,1,0);
HPLUSL=EMA((H+L)/2,3);
OPLUSC=EMA((O+C)/2,3);


Buy=HPLUSL>OPLUSC AND C>=O AND VOLPERCENT>=10 AND MFI(14)>=HHV(MFI(14),7) AND ((C-Ref(C,-1))/Ref(C,-1))*100<8;

Sell=((HPLUSL<=OPLUSC OR ((C-Ref(C,-1))/Ref(C,-1))*100<-4) AND (C<O OR C<Ref(C,-1))  AND MFI(7)<HHV(MFI(7),7)) OR (C<Ref(C,-1) AND C<Ref(C,-2) AND H<Ref(H,-1));

shapebuy=Buy*shapeUpArrow;
shapesell=Sell*shapeDownArrow;

color=IIf(Buy,colorGreen,IIf(C>Ref(C,-1),colorGreen,IIf(Sell,colorRed,colorBlack)));
Plot(Close,"close",Color,styleCandle);
PlotShapes(shapebuy,colorGreen,0,Low,Offset=-15);

VOLBUY=Buy AND VOLPERCENT>=20;

shapevol=VOLBUY*shapeUpTriangle;

VOLSELL=Sell AND VOLPERCENT>-20;

shapevolsell=VOLSELL*shapeDownTriangle;


AlertIf( shapevol, "", "BUY @ " + C, 1 );
PlotShapes(shapevol,colorBlue,0,Low,Offset=-25);
PlotShapes(shapesell,colorRed,0,High,Offset=-15);
PlotShapes(shapevolsell,colorOrange,0,High,Offset=-25);
Title = Name() + " " + Date()+" " + EncodeColor( colorBlue ) +"**********NIRMAL INDICATOR V3********" +EncodeColor( colorRed )
+ " OPEN.... " + O + "... HIGH... " + H + "... LOW... " + L + " ...CLOSE.... "+ C + "...VOLUME INC. %..." + ((V-EMA(V,7))/EMA(V,7))*100 + "\n";
4 comments
Leave Comment
Please login here to leave a comment.
Back
SIR
PLZ TELL ME ONCE THIS AFL INTERDAY TRADING GOOD TIMEFRAMR TELL ME ONCE
Sir, I prepared the afl on the data based on EOD. I have been successfully trading it
profitably. The other Intraday experts please check the formula and leave your comments.
The result is not good when I run backtest using this formula with China Market historical data. Btw, I am using it for Daily trading, not intraDay.
Is this just suitable for US market?
sir, not to bother about back test results.The indicator can give very good
impression of buying and selling pressure so that we can take almost correct
decisions of buy and sell.Please share your daily trading experience, were you
profitable or went into losses ? I usually sell stocks on gaining 4 to 5 percent
(usually within 3 to 4 days), without waiting further. Since extra care was taken
on sell signals (more number of sell signals than buy signals), the back test results
cannot be good. Our eye should judge properly the exit signal basing on the strength
and number of the exit signals. The stress is given more on accurate entry signal
(green plus blue). If this is followed, most probably, we cannot incur losses. Kindly
share your experience. Thanks a lot for the comment.