Stock Portfolio Organizer
The ultimate porfolio management solution.
WiseTrader Toolbox
#1 Selling Amibroker Plugin featuring:
Radiosilk's N-Cross Breakout (v2 of formerly 4-Breakout) for Amibroker (AFL)
This is a Surgical Strike Strategy or “Shoot and Run” type strategy.
Use this AFL on EOD and select your targets. Then on next trading
day (ie, Intraday) Buy if Price goes above High of Buy Signal Bar.
Sell – If price falls below Low of Sell Signal Bar.
1. CLOSE ALL POSITIONS ON THE SAME DAY.
2. Put Stop Loss at High of Buy Signal Bar (once the entry is taken)
3. Put Stop Loss at Low of Sell Signal Bar (once the entry is taken)
4. DO NOT TAKE ANY LOSS AND WAIT FOR A GOOD DAY.
5. This is a good strategy if you want to trade big lot size (assuming your broker doesn’t suck your blood
6. Do not expect this strategy to give any consistent results.
But if used properly it will conserve your capital. And on good days, money should pour in your account.
7. Try paper trading this system before actual trading to gain confidence and comfort level.
8. DO NOT CARRY FORWARD BASED ON THIS SYSTEM.
Hope this helps.
Screenshots
Similar Indicators / Formulas
Indicator / Formula
_SECTION_BEGIN("Radiosilk's N-Cross Breakout");
Buy = Cover = (
Ref( Close , -1 ) > Ref( High , -4 )
OR Ref( Open , -1 ) > Ref( High , -4 )
OR Ref( High , -1 ) > Ref( High , -4 )
OR Ref( Low , -1 ) > Ref( High , -4 )
);
Sell = Short= (
Ref( Open , -1 ) < Ref( Low , -4 )
OR Ref( High , -1 ) < Ref( Low , -4 )
OR Ref( Low , -1 ) < Ref( Low , -4 )
OR Ref( Close , -1 ) < Ref( Low , -4 )
);
Buy = ExRem( Buy, Sell );
Sell = ExRem( Sell, Buy );
Cover = ExRem( Short, Cover );
Short = ExRem( Cover, Short );
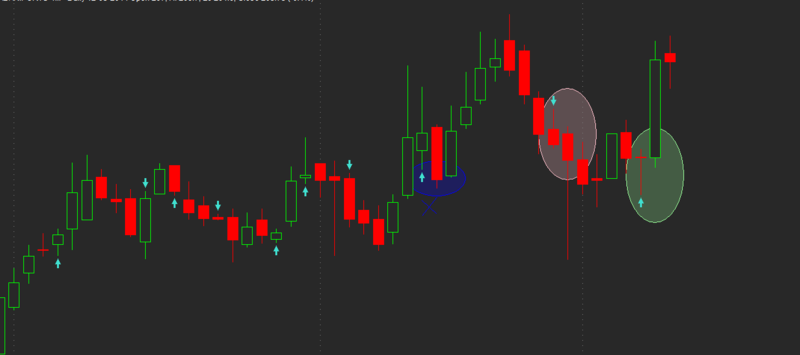
shape = Buy * shapeUpArrow + Sell * shapeDownArrow;
PlotShapes( shape, IIf( Buy, colorTurquoise, colorTurquoise),0, IIf( Buy, Low, High ) );
_SECTION_END();4 comments
Leave Comment
Please login here to leave a comment.
Back
hi..it seems you forgot to plot OHLC….something like
plotOHLC(O,H,L,C,"RADIOSILK.V2",IIf(C>O,colorgreen,colorred),stylecandle);YES CHATPURPOSE SAY’S RIGHT
not able to view the chart with this afl
guys, it is very simple. first pull the basic price chart and then drag & drop this AFL on it. you will be able to see buy/sell arrows on basic price chart.