Stock Portfolio Organizer
The ultimate porfolio management solution.
Shares, Margin, CFD's, Futures and Forex
EOD and Realtime
Dividends and Trust Distributions
And Much More ....
WiseTrader Toolbox
#1 Selling Amibroker Plugin featuring:
Advanced Adaptive Indicators
Advanced Pattern Exploration
Neural Networks
And Much More ....
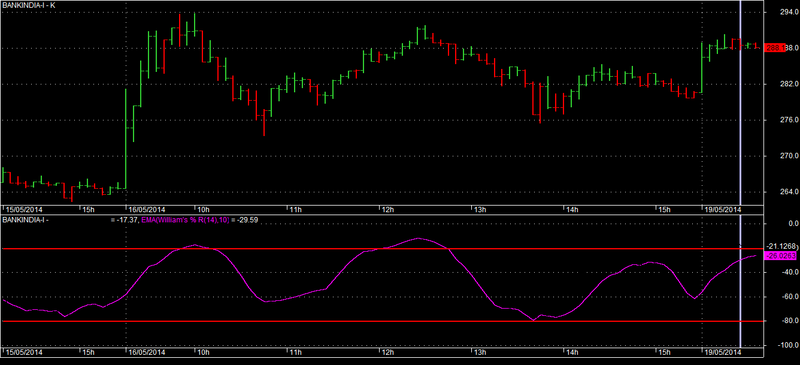
William% with ema for Amibroker (AFL)
Rating:
2 / 5 (Votes 4)
Tags:
oscillator, amibroker
Please follow it.
1. change color of william,s % line as per your panel color to disappear it.
2. Draw horizontal lines at -20 and -80
3. BUY -when line crosses -80 from downword to upward.
4.SELL – when line crosses -20 from upside.
I have prepared it on amibroker 5.3
I am not expert. I prepared it and using it. All suggestions are welcome.
Screenshots
Similar Indicators / Formulas
Febo RSI ..real indicator
Submitted
by abhinavsingh over 12 years ago
Trading Volume Statistic
Submitted
by tuanstock1 almost 10 years ago
Ergodic Oscillator
Submitted
by dljtrader over 13 years ago
3 Days Track
Submitted
by janet0211 almost 14 years ago
Chande Momentum Oscillator
Submitted
by klimpek over 13 years ago
Inverse Fisher Transform Stochastic Oscillator
Submitted
by northstar over 12 years ago
Indicator / Formula
Copy & Paste Friendly
_SECTION_BEGIN("William's % R");
function PercentR( periods )
{
 return -100 * ( HHV( H, periods ) - C )/( HHV( H, periods ) - LLV( L, periods ) );
}

Plot( PercentR( Param("Periods", 14, 2, 100 ) ),
		_DEFAULT_NAME(),
		ParamColor("Color", ColorCycle ) );
_SECTION_END();

_SECTION_BEGIN("EMA");
P = ParamField("Price field",-1);
Periods = Param("Periods", 15, 2, 300, 1, 10 );
Plot( EMA( P, Periods ), _DEFAULT_NAME(), ParamColor( "Color", colorCycle ), ParamStyle("Style") );
_SECTION_END();
1 comments
Leave Comment
Please login here to leave a comment.
Back
dear admin
plz approve the formula
thak you
bchandra bhave