Stock Portfolio Organizer
The ultimate porfolio management solution.
Shares, Margin, CFD's, Futures and Forex
EOD and Realtime
Dividends and Trust Distributions
And Much More ....
WiseTrader Toolbox
#1 Selling Amibroker Plugin featuring:
Advanced Adaptive Indicators
Advanced Pattern Exploration
Neural Networks
And Much More ....
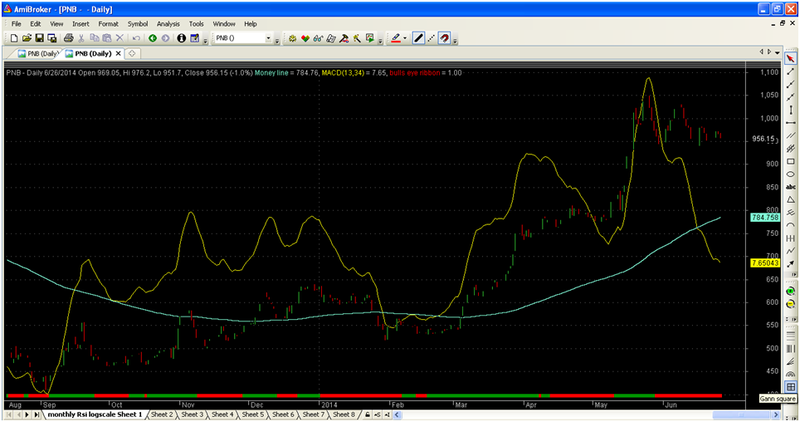
BULLSEYE-MONEYLINE for Amibroker (AFL)
Rating:
3 / 5 (Votes 6)
Tags:
amibroker
If price is above money line,it is bullish. go long.
If price is below moneyline,it is bearish-go short.
Screenshots
Similar Indicators / Formulas
Kavach Of Karna v2
Submitted
by hbkwarez almost 10 years ago
Advanced Elliott Waves
Submitted
by MarcosEn over 12 years ago
3_6Day GuaiLiLv
Submitted
by motorfly over 12 years ago
Williams Alligator System
Submitted
by durgesh1712 over 12 years ago
*Level Breakout system*
Submitted
by Tinych over 12 years ago
Horizontal Live Priceline Tool
Submitted
by northstar over 12 years ago
Indicator / Formula
Copy & Paste Friendly
// bulls eye forecastorby ford7k-banned from traderji
//This one is very easy to code. I tell you the trick you go AND do it yourself

//Money Line Indicator - Use Wilders( C, 88);
//by default, selection of other MA, EMA, WMA - up to you.

//_BullsEye Indicator - Use MACD(EMA13, EMA34, SMA8);
//When MACD() < Signal(), Plot Red Ribbon else Lime Riibbon


_SECTION_BEGIN("Price");
SetChartOptions(0,chartShowArrows|chartShowDates);
_N(Title = StrFormat("{{NAME}} - {{INTERVAL}} {{DATE}} Open %g, Hi %g, Lo %g, Close %g (%.1f%%) {{VALUES}}", O, H, L, C, SelectedValue( ROC( C, 1 ) ) ));
Plot( C, "Close", ParamColor("Color", colorBlack ), styleNoTitle | ParamStyle("Style") | GetPriceStyle() );
_SECTION_END();

_SECTION_BEGIN("Wilders");
P = ParamField("Price field",-1);
Periods = Param("Periods", 88, 2, 300, 1, 10 );
wlc = Ref(C,-1);
Plot( Wilders( wlc, 88 ), "Money line",  colorAqua, styleThick );
_SECTION_END();


_SECTION_BEGIN("MACD");
r1 = Param( "Fast avg", 13, 2, 200, 1 );
r2 = Param( "Slow avg", 34, 2, 200, 1 );
r3 = Param( "Signal avg", 8, 2, 200, 1 );
Plot( ml = MACD(r1, r2), StrFormat(_SECTION_NAME()+"(%g,%g)", r1, r2),  colorYellow , styleOwnScale);
//ribbon
mcd =MACD(13,34);
sig =Signal(13,34,8);

upt=mcd>sig ;
downt=mcd<sig ;


Plot( 1,"bulls eye ribbon",IIf( upt, colorGreen, IIf( downt, colorRed, 0 )),styleOwnScale|styleArea|styleNoLabel, -1, 100 );
3 comments
Leave Comment
Please login here to leave a comment.
Back
Sir ; Nice one .
Which timeframe to be used for intraday and positional .
Please mention .
Thanks
It is Nothing else just Wilders(88) indicator that readily is available in Amibroker Averages section. the program also carelessly writen so you can not change the diagram by changing parameters
How to find stock ?
Afl not working in scan or explore