Stock Portfolio Organizer
The ultimate porfolio management solution.
Shares, Margin, CFD's, Futures and Forex
EOD and Realtime
Dividends and Trust Distributions
And Much More ....
WiseTrader Toolbox
#1 Selling Amibroker Plugin featuring:
Advanced Adaptive Indicators
Advanced Pattern Exploration
Neural Networks
And Much More ....
Weis wave for Amibroker (AFL)
Rating:
4 / 5 (Votes 6)
Tags:
amibroker, trend
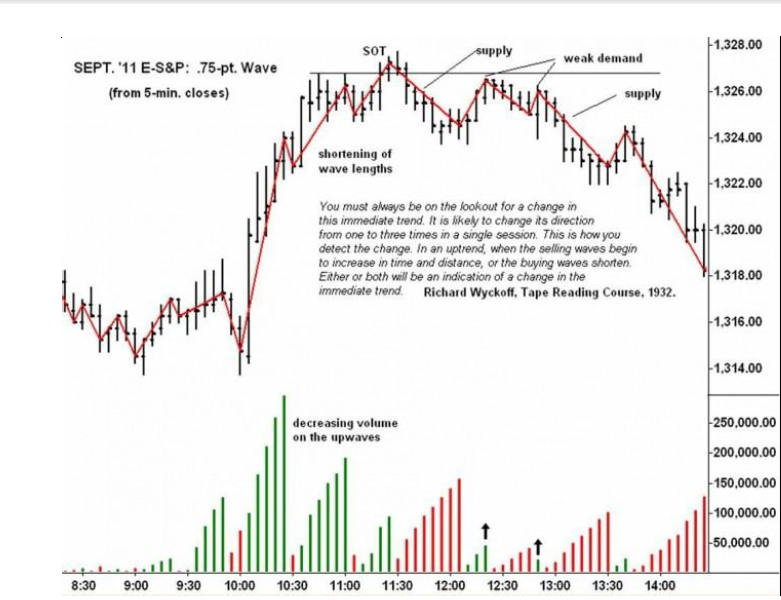
David Weis a veteran VSA teacher commercialized his Weis Wave indicator which is considered as A Modern Adaptation of the Wyckoff Wave & Volume. Get introduced about Weis wave reading the description “Weis Wave Plugin_ A Modern Adaptation of the Wyckoff Wave & Volume” from the link-
http://weisonwyckoff.com/weis-wave/
This is collected one and thanks to original author who took the pain in transforming the code for amibroker also regretting for not mentioning his name as I cant recall his name right now.
Screenshots
Indicator / Formula
Copy & Paste Friendly
_SECTION_BEGIN("WeisWave");
//up[0] = V[0];
//dn[0] = V[0];
//vol[0] = V[0];
trend[0] = 0;
wave[0] = 0;
vol[0] = 0;
mov[0] = 0;
dif=1;
rp    = Param("Reversal Bars", 0.03,0.1,5,0.1);
for( i=1; i<BarCount; i++) {

if (Close[i]-Close[i-1]>rp) mov[i]=1;
if (Close[i]-Close[i-1]==rp) mov[i]=0;
if (Close[i]-Close[i-1]<-rp) mov[i]=-1;

if ((mov[i]!=0) && (mov[i]!=mov[i-1]))
{
trend[i]=mov[i];
}
else {trend[i]=trend[i-1];}
if ((trend[i]!=wave[i-1]) && (abs(Close[i]-Close[i-1])*10000>=dif))
{
wave[i]=trend[i];
}
else
{
wave[i]=wave[i-1];
}
if (wave[i]==wave[i-1])
{
vol[i]=vol[i-1]+Volume[i];
}
else
{
vol[i]=Volume[i];
}

if (wave[i]==1)
{
up[i]=vol[i];
dn[i]=0;
}
if (wave[i]==-1)
{
dn[i]=vol[i];
up[i]=0;
}
if (wave[i]==0)
{
dn[i]=vol[i-1];
up[i]=vol[i-1];
}
}


PlotOHLC(0,up,0,up,"SwingWave",5 , 2|styleThick ) ;
PlotOHLC(0,dn,0,dn,"",4 , 2|styleThick ) ;


GfxSetOverlayMode(1);
GfxSetTextColor(10);
GfxSelectFont("MS Sans Serif", 6, 300, False, False, 0);
GfxTextOut(" By : Casoni ", Status("pxwidth")-60 , Status("pxheight")-13 );
_SECTION_END();
7 comments
Leave Comment
Please login here to leave a comment.
Back
Many thanks Mr.Shariful for sharing. This seems magic code, very very useful.
viswanath
Nice for intraday. Thanks to Mr. Shariful.
Thanks for this Wyckoff formula. I’m not sue why but I do not get the chart as shown above. All I get is the Bar Chart at bottom. Could someone post formula for chart as it appears above. Thanks
Dick
Dick, attach this chart below price chart. This is a kind of volume chart
Thanks kv
Unfortunately I do not have a char similar to one show … would it bge possible to send me a copy of the one shown. Thanks Dick
email: areehoi@yahoo.com
The Plots in the code only provide the Weiss histogram. If you want the bar chart above you need to add a pane with code for a price plot. You can see all this simply by reading the code. Read Weiss’s website for an explanation of his histogram or get his book Trades about to Happen.
very good indicator for trading, thank you so much !