TrendChart v2.0 by rmike for Amibroker (AFL)
rmike over 16 years ago Amibroker (AFL)
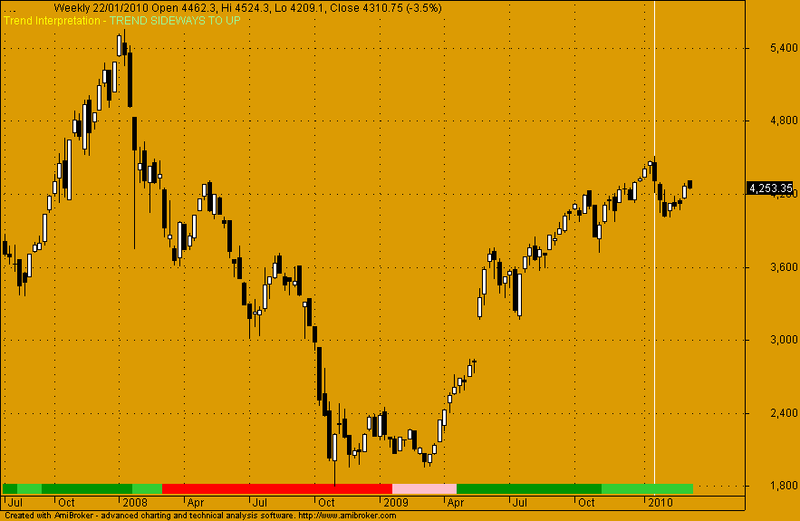
This is a fully customizable price chart for visually indicating the prevalent price trend which can either be depicted in the form of a coloured ribbon or a coloured background with the trend print out in the title. The afl was coded in response to a request for indicating Sideways price movement (Sideways Trend Up or Sideways Trend Down) in addition to the (usually coded) normal Trend Up or Trend Down. This afl is based upon the teachings of Andrew Cardwell and has been coded for eod prices. This works quite nicely when used in conjunction with a weekly chart. The colours for depicting the trends may be changed depending upon your preference by modifying the colour selection parameters for plot colours of TU (Trend Up), TD (Trend Down), TSD (Trend Sideways to down) and TSU (Trend Sideways to Up).
If you find this afl to have been useful in your trading analysis then please do submit your comments.
Regards!
Screenshots
Indicator / Formula
"TrendChart";

//Coding by rmike
//Version 2.0
//Based upon the work of Andrew cardwell

//Intellectual Copyright (for amibroker coding only) - rmike

//Works quite nicely with setting of 13 & higher on a weekly chart. For daily/ Intraday charts you will need to experiment with faster settings,
//the default of 9 is provided.

//You are free to distribute this chart afl with the proviso that it is not modified or edited
//in any way and is distributed with due acknowledgement/ reference to the original author.


p=Param("RSI Periods", 9, 2, 100,1);

A=EMA(C,9);
A1=WMA(C,45);
B=EMA(RSI(p),9);
B1=WMA(RSI(p),45);

TU=A>A1 AND B>B1;
TD=A<=A1 AND B<=B1;
TSU=A>A1 AND B<=B1;
TSD=A<=A1 AND B>B1;

_SECTION_BEGIN("Price");
SetChartOptions(0,chartShowArrows|chartShowDates);
_N(Title = StrFormat("{{NAME}} - {{INTERVAL}} {{DATE}} Open %g, Hi %g, Lo %g, Close %g (%.1f%%) {{VALUES}}", O, H, L, C, SelectedValue( ROC( C, 1 ) ) )
+ EncodeColor(colorYellow) + "\nTrend Interpretation - " + EncodeColor(colorGreen) + WriteIf(TU,"TREND UP","") + EncodeColor(colorRed) + WriteIf(TD,"TREND DOWN","" )
+ EncodeColor(colorPaleGreen) + WriteIf(TSU,"TREND SIDEWAYS TO UP","" ) + EncodeColor(colorPink) + WriteIf(TSD,"TREND SIDEWAYS TO DOWN","" ));
Plot( C, "Close", ParamColor("Color", colorBlack ), styleNoTitle | ParamStyle("Style") | GetPriceStyle() );
_SECTION_END();

if( ParamToggle("Chart Type", "Trend Ribbon|Trend Background" ) )
{
 Plot( 1, "", IIf( TU, ParamColor("TU Color", colorGreen ), IIf( TD, ParamColor("TD Color", colorRed ), IIf(TSU, ParamColor("TSU Color", colorLime ), IIf(TSD, ParamColor("TSD Color", colorPink ), Null )))), styleOwnScale|styleArea|styleNoLabel, 0, 1 );
}
else
{
 Plot( 2, "", IIf( TU, ParamColor("TU Color", colorGreen ), IIf( TD, ParamColor("TD Color", colorRed ), IIf(TSU, ParamColor("TSU Color", colorLime ), IIf(TSD, ParamColor("TSD Color", colorPink ), Null )))), styleOwnScale|styleArea|styleNoLabel, -0.5, 100 );
}
4 comments
Leave Comment
Please login here to leave a comment.
Thanks. The formula is very good. It can be safely used for Intra day as well. The TrendUp and TrendDown may be used for Entry Long or Short. The appearance of respective SideWay Trend colour can be use for Exit even when on Trailing Stop Loss mode. It will be a windfall on a trendy day. On a sideways day, it may be cumbersome as Entry and Exit will be more. But, the possible risk of incurring loss using this technique is very much less than what may occur on normal Stop Loss method. Hence, it is ideal for an active day trader.
I never found so many useful AFL programmes as one can find in this site. Though all are not for sharing, still your graceful attitude of sharing so many Indicators is worth a lot of appreciation. It is touching to know that there are persons like your kind.
Hi Mike. Thanks for this indicator. I am a fan of Andrew Cardwell teachings on RSI. However i am unable to get hold of his teaching books. Any idea if i can have access to his teaching methods or where u learnt from him. ty
very good and work perfect, thanks
thanks